Background subtraction: one threshold for every cell in a microscope image
Afterwards you can subtract an uneven background from a microscope image with a wide Gaussian filter or a top-hat, and check that cells keep their brightness.
- Topic
- Image analysis
- Field
- Biology, Geology, Physics
- Libraries
matplotlib 3.11.2numpy 2.4.3scipy 1.18.1
py-background-subtraction.ipynb, executed with the versions above. The download needs a free account
Run it yourself. In a terminal, this installs exactly the versions above:
pip install numpy==2.4.3 scipy==1.18.1 matplotlib==3.11.2 jupyterlabThe problem
You have a fluorescence microscope image whose background is uneven: twice as bright at the center as in the corners, with dim cells sitting on it. A single threshold either floods the bright center or loses the cells in the dark outer field. You want the background gone, so that one threshold finds every cell, without changing how bright each cell is, and a way to check that on an image that comes with no answer key. The filters and the labeling are explained in Counting cells with scipy.ndimage. The example is a synthetic image of 40 cells, made so the answer can be checked; swap in your own image, cell size, and threshold.
The code
Counting cells with scipy.ndimage keeps sigma well below the radius of the smallest object, because there the blur removes noise and must leave the cells. Here the blur is meant to remove the cells: a Gaussian twice as wide as a cell averages each one away into its surroundings and leaves only the slow background.
import numpy as np
import matplotlib.pyplot as plt
from scipy import ndimage as ndi

# ---- your numbers: µm per px, the largest cell in px, half the height of a dim cell above the background
px, cell_diameter, threshold = 0.65, 25, 0.12

# ---- image: generated, with its truth; for your own, replace this section with image = ....astype(float)
rng, N = np.random.default_rng(3), 512
rows, cols = np.indices((N, N))
true_labels, placed = np.zeros((N, N), dtype=int), []
while len(placed) < 40:                              # 40 disks, 8 px apart, a few cut by the edge
    c, r = rng.uniform(0, N, 2), rng.uniform(10, 12.5)
    if all(np.hypot(*(c - c2)) >= r + r2 + 8 for c2, r2 in placed):
        placed.append((c, r))
        true_labels[(rows - c[0])**2 + (cols - c[1])**2 <= r**2] = len(placed)
cells = ndi.gaussian_filter(rng.uniform(0.2, 0.3, 41)[true_labels] * (true_labels > 0), 1.5)
image = cells + 1.0 - (rows / N - 0.5)**2 - (cols / N - 0.5)**2 + rng.normal(0, 0.03, (N, N))

# ---- background estimate, two ways
bg_gauss = ndi.gaussian_filter(image, sigma=2 * cell_diameter)
smooth = ndi.gaussian_filter(image, 2)
bg_open = smooth - ndi.white_tophat(smooth, size=2 * cell_diameter)   # the opening: what the top-hat removed
corrected = {"Gaussian": image - bg_gauss, "top-hat": image - bg_open}

# ---- one threshold for every cell; the raw image gets it on top of its average background
yy, xx = np.mgrid[-4:5, -4:5]
def find(img, t):
    return ndi.label(ndi.binary_opening(ndi.gaussian_filter(img, 2) > t, structure=xx**2 + yy**2 <= 16))[0]
labels = {"raw": find(image, bg_open.mean() + threshold)} | {n: find(img, threshold) for n, img in corrected.items()}

# ---- check without the truth: the background left on empty field is what sits under each cell
(ny, nx), (rows, cols) = image.shape, np.indices(image.shape)   # from here on, any image works
inner = (rows - ny / 2)**2 + (cols - nx / 2)**2 < (min(ny, nx) / 4)**2
edge_band = ~np.pad(np.ones((ny - 40, nx - 40), dtype=bool), 20)
for name, img in corrected.items():
    empty = ndi.distance_transform_edt(labels[name] == 0) > 5   # beyond the blurred rim of every found cell
    cell = np.median(ndi.mean(img, labels[name], np.arange(1, labels[name].max() + 1)))
    center, edge = np.median(img[empty & inner]), np.median(img[empty & edge_band])
    print(f"{name:8s} empty field: center {center:+.3f} a.u. ({100 * center / cell:+.0f} % of a cell), "
          f"edge {edge:+.3f} a.u. ({100 * edge / cell:+.0f} %), below zero {100 * np.mean(img[empty] < 0):.0f} %")

# ---- plot: outlines are the found regions
fig, axes = plt.subplots(1, 3, figsize=(7.5, 2.8), sharex=True, sharey=True)
for ax, (name, img) in zip(axes, [("raw", image), *corrected.items()]):
    lo, hi = np.percentile(img, [0.5, 99.8]) if name == "raw" else (-threshold, 3 * threshold)
    ax.imshow(img, cmap="gray", vmin=lo, vmax=hi, extent=[0, nx * px, ny * px, 0])
    ax.contour(cols * px, rows * px, labels[name] > 0, levels=[0.5], colors="#c8553d", linewidths=0.8)
    ax.text(0.97, 0.97, name, color="white", fontsize=10, ha="right", va="top", transform=ax.transAxes)
plt.setp(axes, xlabel="x / µm", frame_on=False)
axes[0].set_ylabel("y / µm")

# ---- generated image only (delete for your own): check against the truth, circle true cells not found
def found(lab):                                      # true cells that have a region to themselves
    pairs = np.unique(np.stack([lab, true_labels])[:, (lab > 0) & (true_labels > 0)], axis=1)
    return pairs[1][np.bincount(pairs[0])[pairs[0]] == 1]
ids = np.arange(1, 41)
for ax, (name, lab) in zip(axes, labels.items()):
    yx = np.reshape(ndi.center_of_mass(true_labels > 0, true_labels, np.setdiff1d(ids, found(lab))), (-1, 2)) * px
    ax.plot(yx[:, 1], yx[:, 0], "o", ms=9, mfc="none", mec="#2a7f9e", mew=1.2)
    if name == "raw":
        sweep = ", ".join(f"{t:.2f}: {found(find(image, t)).size}" for t in (0.90, 1.00, 1.05))
        print(f"raw      found {found(lab).size} of 40 at {bg_open.mean() + threshold:.2f} a.u. (at {sweep})")
    else:
        kept = ndi.mean(corrected[name], true_labels, ids) / ndi.mean(cells, true_labels, ids)
        print(f"{name:8s} found {found(lab).size} of 40, brightness kept: median {np.median(kept):.3f}, worst {kept.min():.3f}")
Gaussian empty field: center +0.003 a.u. (+1 % of a cell), edge -0.060 a.u. (-27 %), below zero 64 %
top-hat  empty field: center +0.006 a.u. (+3 % of a cell), edge +0.002 a.u. (+1 %), below zero 46 %
raw      found 27 of 40 at 0.95 a.u. (at 0.90: 23, 1.00: 34, 1.05: 29)
Gaussian found 39 of 40, brightness kept: median 0.979, worst 0.596
top-hat  found 40 of 40, brightness kept: median 0.988, worst 0.907
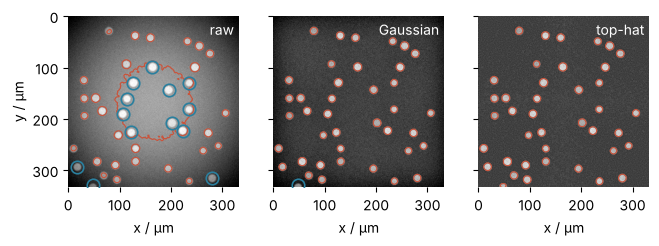
One threshold 0.12 a.u. above the average background finds 27 of the 40 cells in the raw image: the bright center floods into one region, and dim cells in the corners fall below it. No threshold in the sweep does better than 34. After the top-hat the same 0.12 a.u. finds all 40, after the Gaussian 39, and the median cell keeps 99 % and 98 % of its brightness. The check that needs no truth tells the two apart. After the top-hat the empty field sits within 3 % of a cell's brightness of zero, center and edge alike; after the Gaussian it falls to -0.060 a.u. along the edge, 27 % of a cell, which the last pitfall explains.
The knobs
cell_diameter, the largest cell in pixels, sets the scale of both filters at twice its value: the Gaussian's sigma and the top-hat's window. The estimate must not see the cells. Too small a scale and it follows the cells and eats them, as the first pitfall shows; too large and the Gaussian no longer follows the curve of the background. threshold is half the height of a dim cell above the background, in your image's units; px only labels the axes. The top-hat smooths with sigma=2 first because its opening starts from the darkest value in each window, and on raw noise that is a noise dip, which puts the estimate below the background. Its opening is then subtracted from the unsmoothed image, so the cells stay sharp. Choose the Gaussian when the cells are sparse and away from the edge: it is one call and assumes nothing about what it removes. Choose the top-hat when cells are crowded or reach the edge, as here.
Subtract when the extra light is added to the cells (out-of-focus glow, autofluorescence, stray light), the case generated here. Divide when the illumination or the optics make the same cell dimmer in the corner than at the center, as uneven excitation and vignetting do. A flat-field image decides: an image of a uniform fluorescent slide or dye solution, taken with the same settings, so it shows only how bright the microscope makes a uniform sample at each point. If it is flat, your background is added light; subtract. If it falls off toward the corners as your background does, the light is multiplied; divide, (image - dark) / (flat - dark) * (flat - dark).mean(), with dark an image taken with no light, removing the camera offset. Without a slide, subtract and accept the limit below.
The empty-field check is the one to run on your own image. A cell's measured brightness is its own light plus the background left beneath it, so an empty field at zero, at the center and along the edge alike, means the cells kept their brightness. Count a few percent of a cell as zero. The 5 px margin keeps the blurred rim of each cell out of the empty field. The check rests on the additive model and cannot see a multiplicative falloff; that is what the flat-field image is for.
Pitfalls
A filter scale too close to the cell size. At the cell diameter itself one threshold still finds every cell here, but the estimate has begun to follow the cells: they come out dimmer, and the Gaussian rings each one with a dark halo. Go well below the cell size and the estimate eats the cells outright, so the half-height threshold, set for cells at full brightness, misses them. Go back to twice the largest cell.
Negative values after subtraction. On empty field the corrected image is below zero at about half the pixels, 46 % after the top-hat in the output above. That is noise around a zero background, and it is correct. On a uint16 image those pixels wrap around to values near 65,535 and become the brightest things in the picture. Convert to float before subtracting, keep the negatives for measuring, since clipping at zero biases every mean upward, and clip only for display.
Cells at the image edge. The negative edge value of the empty field under the Gaussian, read off after the code, is not noise. The filter has no data beyond the edge and mirrors the image there (mode="reflect"), so a background that falls toward the edge is mirrored back up, and the estimate near the edge comes out too high. The cells there come out dim: the worst one, cut in half by the bottom edge, keeps 60 % of its brightness under the Gaussian and drops below the threshold, the one cell of 40 it misses, while the top-hat's worst cell keeps 91 %. That is why the knobs send cells at the edge to the top-hat. The other fix is to leave out the cells the edge cuts, which Counting cells with scipy.ndimage does for particle sizes anyway.