Save a parameter sweep in one HDF5 file with h5py and find any run again
Afterwards you can store a parameter sweep in one HDF5 file with h5py, parameters as attributes, and select runs and series by their parameters later.
- Field
- Cross-disciplinary
- Libraries
h5py 3.16.0matplotlib 3.11.2numpy 2.5.3
py-hdf5-parameter-sweep.ipynb, executed with the versions above. The download needs a free account
Run it yourself. In a terminal, this installs exactly the versions above:
pip install h5py==3.16.0 numpy==2.5.3 matplotlib==3.11.2 jupyterlabThe problem
You ran one simulation for 48 parameter pairs and have 48 CSV files, each named after its parameters, run_T300_B4.5.csv. Finding all runs at 300 K is a glob pattern, and a renamed file is a lost run. You want one file that holds every series with its parameters, its summary numbers, and the version of the code that made it, and that you can search by parameter. The recipe builds that file from the groups and attributes of HDF5 with h5py. The example is a resonator driven at 1 Hz whose resonance shifts with the magnetic field and broadens with temperature, 4 temperatures times 12 fields; swap in your own parameters, axis, series, simulate, and summary numbers.
The code
A group behaves like a dictionary, as attrs did in the prerequisite: runs.items() gives every run's name and group, runs.values() the groups alone, and name in runs asks whether a run exists. After the loop the code copies every attribute into results, one column per attribute, so that a question across all 48 runs reads one array instead of opening 48 groups. The keys of PARAMS are the argument names of simulate, because each run calls simulate(**p). The body of simulate is a stand-in model of a driven oscillator. You need not follow it, only replace it.
import os, datetime
import numpy as np
import h5py
import matplotlib.pyplot as plt

# ---- your sweep: replace everything in this section
TEMPERATURES = [100, 200, 300, 400]                         # K, the outer loop: runs 0 to 11 are at 100 K
FIELDS = [1.5 + 0.5 * k for k in range(12)]                 # mT
PARAMS = [{"temperature": T, "field": B} for T in TEMPERATURES for B in FIELDS]
AXIS, SERIES = "time", "signal"                             # names in the file: the shared axis, each series
t = axis = np.linspace(0, 50, 5000, endpoint=False)         # s; the file stores `axis` as AXIS
UNITS = {"temperature": "K", "field": "mT", "amplitude": "nm", "peak": "nm",
         SERIES: "nm", AXIS: "s"}                           # the write section takes every unit from here
CODE_VERSION = "sweep 1.0"                                  # better: your git commit
rng = np.random.default_rng(326)
def simulate(temperature, field):                           # a stand-in for your simulation
    w, w0, gamma = 2 * np.pi, 2 * np.pi * 0.25 * field, 0.002 * temperature
    z = 1 / (w0**2 - w**2 + 2j * gamma * w)                 # steady response of a driven oscillator
    return (1 - np.exp(-gamma * t)) * np.real(z * np.exp(1j * w * t)) + 0.01 * rng.standard_normal(t.size)
def summarize(x):                                           # your own summary numbers
    return {"amplitude": np.sqrt(2) * x[t >= 40].std(), "peak": np.abs(x).max()}

# ---- write the sweep: no changes needed below for your own sweep
with h5py.File("sweep.h5", "w") as f:
    f.attrs.update({"code_version": CODE_VERSION, "created": datetime.date.today().isoformat()})
    f.create_dataset(AXIS, data=axis).attrs["units"] = UNITS[AXIS]
    runs = f.create_group("runs")
    for i, p in enumerate(PARAMS):
        x = simulate(**p)
        g = runs.create_group(f"run_{i:02d}")
        g.attrs.update({"run": i, **p, **summarize(x)})
        g.create_dataset(SERIES, data=x, compression="gzip", shuffle=True).attrs["units"] = UNITS[SERIES]
    for name in runs["run_00"].attrs:                       # the table is built from the groups
        col = f.create_dataset(f"results/{name}", data=[g.attrs[name] for g in runs.values()])
        if name in UNITS:                                   # "run" is a count and gets no unit
            col.attrs["units"] = UNITS[name]

# ---- find runs again: your questions go here
fig, ax = plt.subplots(figsize=(7, 4), dpi=110)
with h5py.File("sweep.h5", "r") as f:
    print(f"code version {f.attrs['code_version']}; file attributes: {', '.join(f.attrs)}")
    at_300 = [name for name, g in f["runs"].items() if g.attrs["temperature"] == 300]
    print(f"{len(at_300)} runs at 300 K: {', '.join(at_300)}")
    res = {name: col[:] for name, col in f["results"].items()}
    k = np.argmax(res["amplitude"])
    run = res["run"][k]                                     # the group name comes from this column, not from k
    x = f[f"runs/run_{run:02d}/{SERIES}"][:]
    print(f"largest: run_{run:02d} ({res['temperature'][k]} K, {res['field'][k]} mT), "
          f"{x.size} points, amplitude {summarize(x)['amplitude']:.3f} nm")
    for T, alpha in zip(TEMPERATURES, [1, 0.7, 0.45, 0.25]):  # one color, fainter as T rises
        m = res["temperature"] == T
        ax.plot(res["field"][m], res["amplitude"][m], "o-", color="#1f2a44", alpha=alpha, ms=6, label=f"{T} K")
    ax.plot(res["field"][k], res["amplitude"][k], "o", ms=14, mfc="none", mew=1.5, color="#c8553d")
    ax.set(xlabel=f"field / {f['results/field'].attrs['units']}",
           ylabel=f"amplitude / {f['results/amplitude'].attrs['units']}")
ax.legend(frameon=False)
ax.spines[["top", "right"]].set_visible(False)

# ---- the same sweep as 48 CSV files, for comparison only: delete it for your own sweep
os.makedirs("sweep_csv", exist_ok=True)
with h5py.File("sweep.h5", "r") as f:
    for g in f["runs"].values():
        np.savetxt(f"sweep_csv/run_T{g.attrs['temperature']}_B{g.attrs['field']}.csv",
                   np.column_stack([t, g[SERIES][:]]), delimiter=",", header="t,x")
csv_mb = sum(os.path.getsize(f"sweep_csv/{n}") for n in os.listdir("sweep_csv")) / 1e6
print(f"one HDF5 file: {os.path.getsize('sweep.h5') / 1e6:.2f} MB; 48 CSV files: {csv_mb:.1f} MB")
plt.show()
code version sweep 1.0; file attributes: code_version, created
12 runs at 300 K: run_24, run_25, run_26, run_27, run_28, run_29, run_30, run_31, run_32, run_33, run_34, run_35
largest: run_05 (100 K, 4.0 mT), 5000 points, amplitude 0.398 nm
one HDF5 file: 1.96 MB; 48 CSV files: 12.1 MB
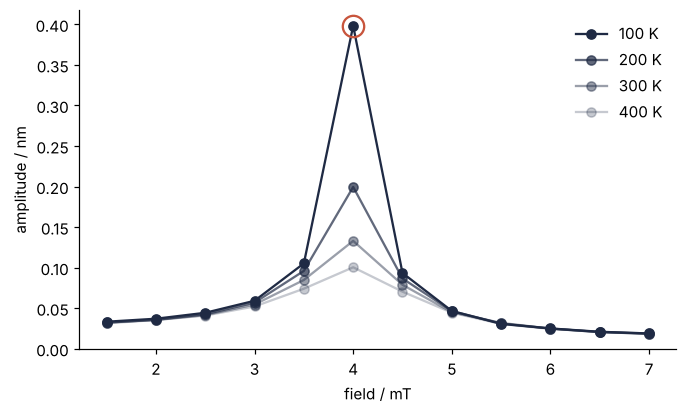
The twelve runs at 300 K are run_24 to run_35, and the largest amplitude, 0.398 nm recomputed from the series read back, belongs to run_05 at 100 K and 4.0 mT: the circled peak among the four curves, drawn in one color that fades from 100 K to 400 K. The one file is 1.96 MB, the CSV folder 12.1 MB, about a sixth.
The knobs
The layout is one group per run. The other choice is one 2-D dataset signals of shape (48, 5000), which reads a slice across all runs in one call but needs every run to have the same length and the same outputs, and a run added later means a resize. Groups take runs of any length and extra datasets, and each carries its own parameters, so it says what it is when read alone. h5py picks the chunks itself, here four of 1,250 values per series. If you always read a series whole, chunks=(5000,) makes that one chunk per read; if you read parts, keep the automatic choice. On these noisy doubles gzip alone makes the file 1 % larger than no compression, and gzip with shuffle=True makes it 5 % smaller. The factor of six against the CSV folder has two parts: binary storage, 8 bytes per value against about 25 characters in np.savetxt's default format, %.18e, gives a factor of three, and the CSV files repeat the time column 48 times where the HDF5 file stores it once, which gives another two. Compression pays on smooth or integer data. Replace CODE_VERSION with the commit hash, as in Figure provenance in Matplotlib.
A row of results finds its run through the run column, never through its position. Here the rows come out in run order because runs.values() goes through the groups in name order and the names are zero-padded (pad to three digits from 100 runs on). After a resume, a deleted run, or a sorted table, only the run column is right. The table repeats the attributes on purpose: built from them, it cannot disagree with them. Selecting with == works here because 300 and 1.5 + 0.5 k are exact in binary. A concentration built as 0.1 * k is 0.30000000000000004 at k = 3, and == 0.3 finds nothing, without an error; build it as k / 10 or compare with np.isclose. The amplitude is the steady response, √2 times the standard deviation of the last 10 s. The noise of 0.01 nm alone gives √2 × 0.01 ≈ 0.014 nm, and the 0.019 nm at 7.0 mT is the model's 0.012 nm and that noise added in quadrature. The peaks fall as 1/T, from 0.398 nm at 100 K to 0.100 nm at 400 K, but the file layout does not depend on the model.
Pitfalls
A large array in an attribute. A series of 5,000 doubles fits into attrs, and one of 10,000 fails with OSError: Unable to synchronously create attribute (object header message is too large). Attributes live in the header of their group or dataset, and in the file format h5py writes by default HDF5 limits each to 64 kB, a little over 8,000 doubles (libver="latest" lifts the limit). Arrays go into datasets; attributes hold numbers and short strings.
A sweep that stopped halfway. When run 30 raises an error, the with block closes the file on the way out, so runs holds run_00 to run_29 and there is no results (without the with block the file stays open, as HDF5 with h5py shows). Starting over throws away 30 runs. To continue instead, open with "a", write time only if "time" not in f, get the group with f.require_group("runs"), which creates it only when it is missing, skip every run whose name is already in runs, and del f["results"] if it exists before the table is built. The build after the loop then makes the table again from all 48 groups, old and new; that is why the table is built from the groups and never appended to. The resumed runs draw different noise than one pass would, because the generator starts over.
Several processes writing one file. Hand the loop to the workers of a ProcessPoolExecutor, each opening sweep.h5 to add its run, and the second writer stops with BlockingIOError: [Errno 11] Unable to synchronously open file (unable to lock file, errno = 11, ...). HDF5 locks a file it has open for writing. On a file system without locking, some network file systems among them, nothing stops the second writer, and two writers can corrupt the file without an error. Let the workers return their arrays and the parent process write them, as in Parallel runs with concurrent.futures, or give each worker its own file.