Read a folder of CSV files into one pandas DataFrame
Afterwards you can read a folder of CSV files into one pandas table with each row's file and a sorted time index, and flag missing or short files.
- Topic
- Data wrangling
- Field
- Cross-disciplinary
- Libraries
matplotlib 3.11.2numpy 2.5.4pandas 3.0.6
py-read-many-csv.ipynb, executed with the versions above. The download needs a free account
Run it yourself. In a terminal, this installs exactly the versions above:
pip install numpy==2.5.4 pandas==3.0.6 matplotlib==3.11.2 jupyterlabThe problem
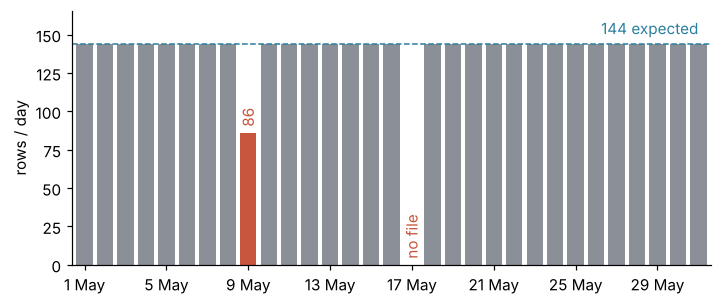
You have a folder of CSV files, one per day, all with the same columns. You want them as one pandas DataFrame: every row with the name of the file it came from, the timestamps parsed and sorted, and a count per day that shows at a glance which files are missing or short. The example is May 2026 from a three-sensor temperature logger, one row every 10 minutes: 31 days, but the file for 17 May was lost to a card error, so 30 files, and on 9 May the battery died at 14:20. Swap in your own folder and the settings at the top of the code. Everything else is from pandas from the ground up.
The code
pd.concat stacks a list of tables into one, matching columns by name. The loop checks each file's header before it goes on the list, so that a renamed column stops the run instead of passing silently (see Pitfalls).
from pathlib import Path
import numpy as np
import pandas as pd
import matplotlib.pyplot as plt
import matplotlib.dates as mdates

# ---- your folder, file pattern, columns, and sampling interval
FOLDER, PATTERN = Path("logger"), "logger_*.csv"
COLUMNS = ["time", "t1", "t2", "t3"]
INTERVAL = "10min"

# ---- the logger: writes 30 daily files; delete this block and use your own folder
rng = np.random.default_rng(20261018)
FOLDER.mkdir(exist_ok=True)
for old in FOLDER.glob("logger_2026-05-*.csv"):        # a file left from an earlier run would be read too
    old.unlink()
for day in pd.date_range("2026-05-01", "2026-05-31"):
    if day.day == 17:                                    # lost to a card error
        continue
    stop = pd.Timedelta("14h20min" if day.day == 9 else "1D")   # battery died on 9 May
    time = pd.date_range(day, day + stop, freq=INTERVAL, inclusive="left")
    hour = time.hour + time.minute / 60
    log = pd.DataFrame({"time": time})
    for name, mean, amp in [("t1", 14, 5), ("t2", 17, 8), ("t3", 12, 1.5)]:
        cycle = amp * np.cos(2 * np.pi * (hour - 15) / 24)
        log[name] = np.round(mean + cycle + rng.normal(0, 0.3, time.size), 2)
    log.to_csv(FOLDER / f"logger_{day:%Y-%m-%d}.csv", index=False)

# ---- read
paths = sorted(FOLDER.glob(PATTERN))
frames = []
for path in paths:
    df = pd.read_csv(path, parse_dates=["time"], dtype={"t1": float, "t2": float, "t3": float})
    if list(df.columns) != COLUMNS:                      # concat would not complain, see Pitfalls
        raise ValueError(f"{path.name}: columns {list(df.columns)}")
    df["source"] = path.name
    frames.append(df)
table = pd.concat(frames, ignore_index=True).set_index("time").sort_index()

# ---- report and plot
expected = pd.Timedelta("1D") // pd.Timedelta(INTERVAL)
print(f"{len(paths)} files, {len(table):,} rows, {table.index[0]:%Y-%m-%d %H:%M} "
      f"to {table.index[-1]:%Y-%m-%d %H:%M}, {expected} rows expected per day")
print(table.head(3))
per_day = table["source"].resample("D").count()
bad = per_day != expected
print(per_day[bad])

fig, ax = plt.subplots(figsize=(7.5, 3), dpi=110)
ax.bar(per_day.index, per_day, width=0.8, color=np.where(bad, "#c8553d", "#8a8f98"))
ax.axhline(expected, color="#2a7f9e", ls="--", lw=1)
ax.text(per_day.index[-1], expected + 4, f"{expected} expected", color="#2a7f9e", ha="right", va="bottom")
for day, n in per_day[bad].items():                      # name the bad days; a zero bar is invisible
    ax.text(day, n + 4, str(n) if n else "no file", color="#c8553d", rotation=90, ha="center", va="bottom")
ax.set(ylabel="rows / day", ylim=(0, expected * 1.15),
       xlim=(per_day.index[0] - pd.Timedelta("15h"), per_day.index[-1] + pd.Timedelta("15h")))
ax.xaxis.set_major_formatter(lambda x, pos: f"{mdates.num2date(x):%d %b}".lstrip("0"))   # "%-d" fails on Windows
ax.spines[["top", "right"]].set_visible(False)
plt.show()
30 files, 4,262 rows, 2026-05-01 00:00 to 2026-05-31 23:50, 144 rows expected per day
                        t1     t2     t3                 source
time
2026-05-01 00:00:00  10.98  11.09  10.92  logger_2026-05-01.csv
2026-05-01 00:10:00  10.37  11.06  10.57  logger_2026-05-01.csv
2026-05-01 00:20:00  10.92  10.59  10.52  logger_2026-05-01.csv
time
2026-05-09    86
2026-05-17     0
Name: source, dtype: int64
The knobs
parse_dates turns each file's text timestamps into datetimes, so the stacked index is a real time index and resample can count by day. ignore_index=True drops the row numbers, which start at 0 in every file and which that index replaces anyway. dtype pins the three sensors to float, so a logger that writes ERR into one field stops the loop at that file with ValueError: could not convert string to float: 'ERR', whose message does not name the file, although path still holds it. Without dtype the column of that one file is read as text, and after the concat the column mixes numbers and strings and fails the first time you take a mean. The expected count is one day divided by INTERVAL, 24 h over 10 min, which is 144, and 29 full days plus the 86 rows of 9 May make the 4,262 rows printed above. Set INTERVAL to your own sampling interval and the check follows ("1s" expects 86,400 rows a day), unless the logger has no fixed clock, in which case its rows per day are for reading, not for flagging.
glob returns the files that match the pattern (* stands for any characters) in whatever order the file system keeps them. sorted puts the names in alphabetical order, which is time order only when the date in the name is written the ISO way: logger_2026-05-09.csv comes before logger_2026-05-10.csv, but day_10.csv comes before day_2.csv. sort_index sorts by the timestamps themselves and is right whatever the names, and sorting the paths as well makes the checks stop at the earliest bad file. The count per day also shows less than it seems to: a 0 marks a missing file only between the first and the last day present, so a missing 1 May would start the count on 2 May with nothing flagged. Put your own first and last day into per_day = per_day.reindex(pd.date_range("2026-05-01", "2026-05-31", tz=per_day.index.tz), fill_value=0) before the check, and keep the tz: after the daylight saving fix below, a range without it matches no day of the localized index, and every count comes out 0.
Pitfalls
A file with a different header. A firmware update renames t3 to T3, and every file from that day on carries the new name. Without the check in the loop, concat treats T3 as a fifth column: t3 is NaN for the late days, T3 is NaN for the early ones, and no error is raised. The check stops at the first file whose header differs and prints its name and columns. If the rename is known, undo it with df = df.rename(columns={"T3": "t3"}) right after read_csv.
A daylight saving switch inside the month. In Central European Time ("Europe/Berlin"), clocks go forward one hour on 29 March 2026 and back one hour on 25 October, so a logger on local time writes 138 rows on the spring day and 150 on the autumn day. Worse, sort_index puts the two copies of the repeated hour side by side, and 02:10 summer time can no longer be told from 02:10 winter time. Unless the logger can write UTC, attach its zone inside the loop, right after read_csv: df["time"] = df["time"].dt.tz_localize("Europe/Berlin", ambiguous="infer"). Here .dt applies a timestamp method to every row, and "infer" tells the first copy of a time that occurs twice from the second by the order the logger wrote them, an order only the unsorted file still has. The index is then in true time order, but the 138 and the 150 stay: those days last 23 h and 25 h, and the two flags are correct.
Appending in a loop. Writing table = pd.concat([table, df]) inside the loop copies the growing table at every file, so the run time grows with the square of the number of files: ten times the files, a hundred times the copying. Older answers on the web use DataFrame.append instead, which pandas 2.0 removed, and which now fails with AttributeError. Collect the tables in a list and call concat once at the end, as the code does.