Smoothing splines with scipy.interpolate: acceleration from noisy positions
Afterwards you can fit a smoothing spline to noisy data with scipy.interpolate, choose how much it smooths, and take derivatives the noise does not swamp.
- Field
- Cross-disciplinary
- Libraries
matplotlib 3.11.2numpy 2.5.4scipy 1.18.1
py-smoothing-spline.ipynb, executed with the versions above. The download needs a free account
Run it yourself. In a terminal, this installs exactly the versions above:
pip install numpy==2.5.4 scipy==1.18.1 matplotlib==3.11.2 jupyterlabThe problem: g from a falling ball's video track
A camera films a ball falling from rest at 100 frames per second, and a tracking program reads off its height in every frame: 81 heights over 0.8 s, each good to 1 mm. The acceleration should come out as 9.81 m/s². Take the second difference, \((h_{i+1} - 2h_i + h_{i-1})/\Delta t^2\), and it comes out with a scatter of 25 m/s², more than twice the signal. The stencil adds three independent errors with weights 1, −2, 1, so their variances add as \(1 + 4 + 1\), and the noise of the result is
The first difference, the velocity, is still fine: \(\sqrt{2}\,\sigma/\Delta t = 0.14\) m/s against a final speed of \(g \times 0.8\ \text{s} = 7.8\) m/s. Each derivative costs another factor \(1/\Delta t\). This is the noisy half of the step-size trade-off in Floating-point numbers: why 0.1 + 0.2 is not 0.3, and a derivative's best step: there the error came from rounding, here from the measurement, and a smaller step makes it worse in both cases.
The way out is to fit a smooth curve to the heights first and differentiate the curve. A smoothing spline from scipy.interpolate is that curve, and the whole question is how smooth to make it.
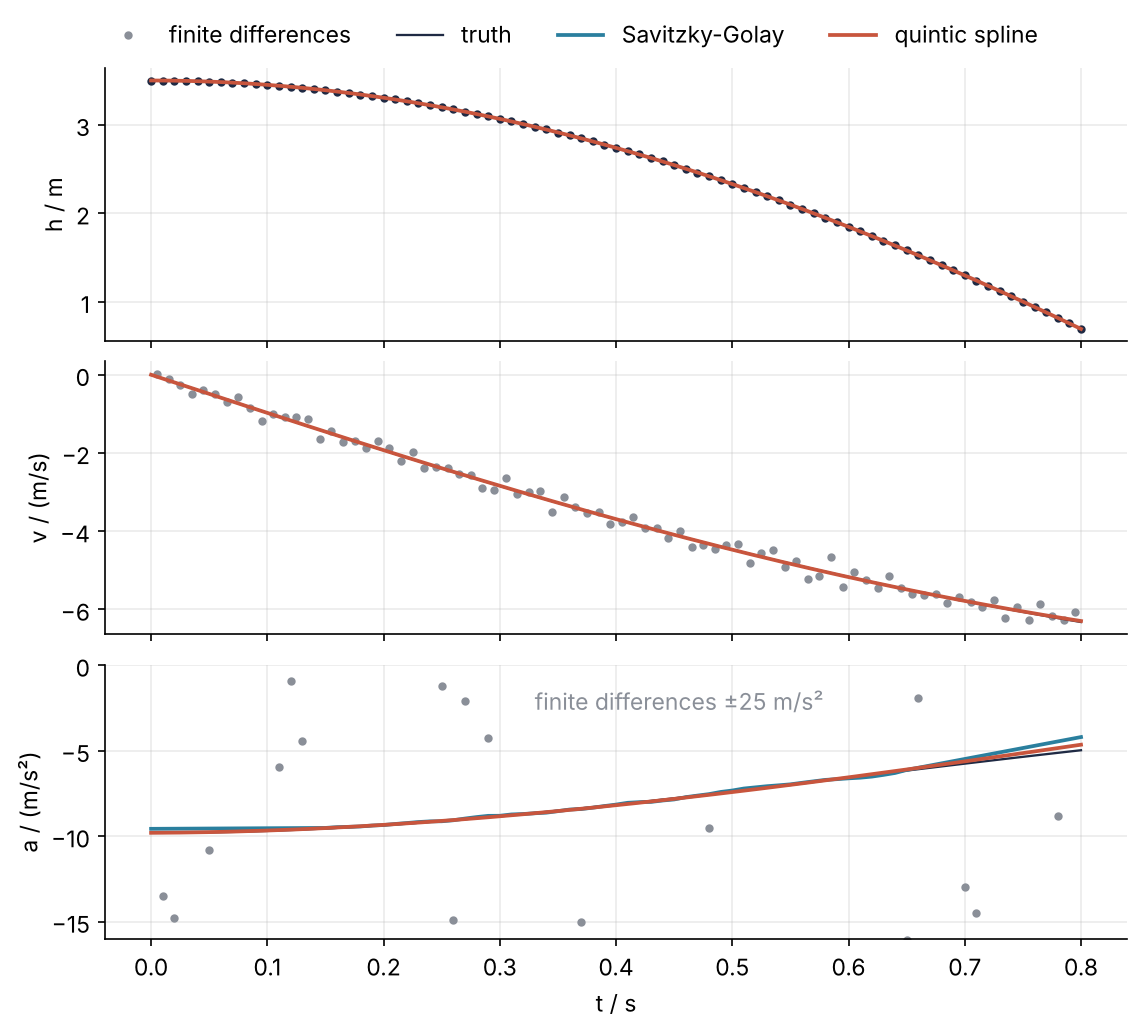
This is where we end up, for a table-tennis ball that air drag slows down: the spline's acceleration follows the true one as it eases from 9.8 to 5 m/s², while the finite differences scatter off the panel. The spline is fitted once to the heights and differentiated twice.
Setup
Two balls, dropped from 3.5 m: a steel ball for which drag is negligible, and a table-tennis ball with quadratic drag and a terminal speed of 9 m/s, whose height has a closed form. Both get Gaussian noise of 1 mm from one seeded generator.
import warnings

import numpy as np
import matplotlib.pyplot as plt
from scipy.interpolate import make_smoothing_spline, make_splrep
from scipy.signal import savgol_filter

g = 9.81          # m/s^2
dt = 0.01         # s, 100 frames per second
sigma = 1e-3      # m, tracking error per frame
h0 = 3.5          # m, release height
v_t = 9.0         # m/s, terminal speed of the table-tennis ball

plt.rcParams.update({
    "figure.figsize": (7, 3.6), "figure.dpi": 110,
    "axes.spines.top": False, "axes.spines.right": False,
    "axes.grid": True, "grid.alpha": 0.25,
    "font.size": 11, "lines.linewidth": 1.8,
})
INK, ACCENT, SECOND, MUTED = "#1f2a44", "#c8553d", "#2a7f9e", "#8a8f98"

t = np.arange(81) * dt
n = t.size
rng = np.random.default_rng(2026)

# steel ball, free fall
h_free_true = h0 - 0.5 * g * t**2
h_free = h_free_true + rng.normal(0, sigma, n)

# table-tennis ball, quadratic drag, exact solution
x = g * t / v_t
h_drag_true = h0 - v_t**2 / g * np.log(np.cosh(x))
v_drag_true = -v_t * np.tanh(x)
a_drag_true = -g / np.cosh(x) ** 2
h_drag = h_drag_true + rng.normal(0, sigma, n)

rms = lambda e: np.sqrt(np.mean(np.square(e)))
mid = slice(5, -5)                       # 50 to 750 ms, away from both ends

a_fd = np.diff(h_free, 2) / dt**2
print(f"{n} heights; second difference: mean {a_fd.mean():.1f} m/s², std {a_fd.std():.1f} m/s²")
81 heights; second difference: mean -9.7 m/s², std 25.0 m/s²
Step 1: Fit a smoothing spline to the positions
A spline is a chain of polynomial pieces, cubic here, joined at points called knots so that value, slope, and curvature are continuous across each joint. A smoothing spline does not pass through the data. make_smoothing_spline puts a knot at every sample and finds the curve \(f\) that minimizes
closeness to the data \(y_i\) against bending, with weights \(w_i\) that default to one. The parameter \(\lambda\) decides between the two. Leave it out, and the function picks it by generalized cross-validation (GCV). Plain cross-validation would leave each point out in turn, predict it from the others, and keep the \(\lambda\) that predicts best. GCV approximates that score from one fit per \(\lambda\): it divides the residual by how much freedom the fit has left, so a \(\lambda\) that buys a small residual by chasing the noise gains nothing.
spl = make_smoothing_spline(t, h_free)
resid = h_free - spl(t)
print(type(spl).__name__, "with", len(spl.t), "knots, degree", spl.k)
print(f"rms residual {1e3 * rms(resid):.2f} mm   (noise σ = {1e3 * sigma:.0f} mm)")
BSpline with 87 knots, degree 3
rms residual 0.86 mm   (noise σ = 1 mm)
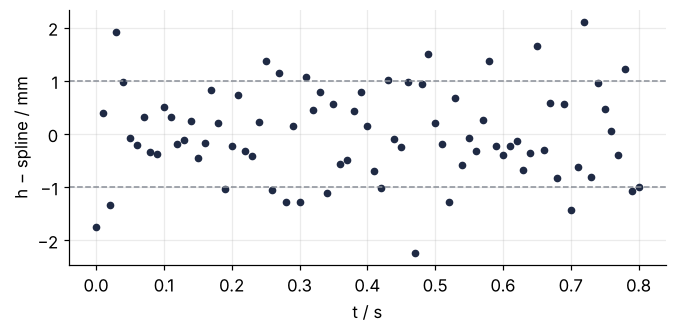
The result is a BSpline, called like a function. spl.t is its knot vector: the 81 sample times with each end time repeated until it appears k + 1 = 4 times, 87 entries in all, a storage habit of B-splines that Step 4 relies on. The residuals are 0.86 mm rms, just under the noise of 1 mm. The spline follows the fall and leaves the noise behind.
fig, ax = plt.subplots(figsize=(7, 3))
ax.plot(t, 1e3 * resid, "o", color=INK, ms=4)
for level in (-1, 1):
    ax.axhline(level, color=MUTED, lw=1, ls="--")
ax.set(xlabel="t / s", ylabel="h − spline / mm")
plt.show()
Step 2: Too little and too much smoothing
To see what GCV chose, set lam by hand. The data are synthetic, so each fit gets two numbers: its distance from the data, and from the true curve.
print(" lambda / s³   residual / mm   error vs truth / mm")
for lam in [1e-9, 1e-7, 1e-6, 1e-5, 1e-3, 1e-2]:
    s = make_smoothing_spline(t, h_free, lam=lam)
    print(f"   {lam:7.0e}      {1e3 * rms(h_free - s(t)):6.2f}          {1e3 * rms(h_free_true - s(t)):6.2f}")
print(f"   {'GCV':>7s}      {1e3 * rms(resid):6.2f}          {1e3 * rms(h_free_true - spl(t)):6.2f}")
 lambda / s³   residual / mm   error vs truth / mm
     1e-09        0.02            1.01
     1e-07        0.51            0.73
     1e-06        0.73            0.61
     1e-05        0.91            0.63
     1e-03        6.91            6.95
     1e-02       29.45           29.43
       GCV        0.86            0.59
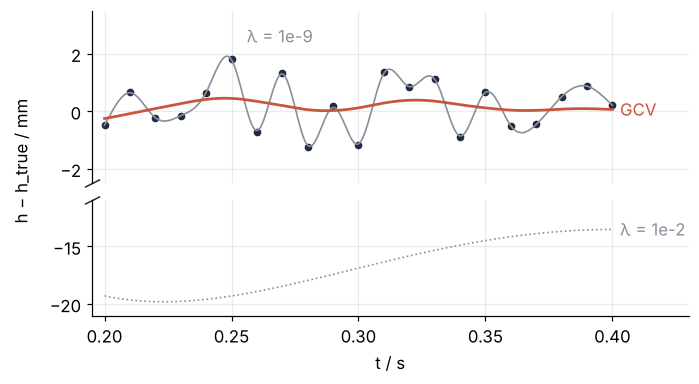
A small \(\lambda\) runs through the points and keeps the noise whole: 0.02 mm from the data, 1.01 mm from the truth. A large one bends 29 mm away from the parabola. GCV does not report its \(\lambda\), but its residual of 0.86 mm places it between the rows for 1e-6 and 1e-5, and its error of 0.59 mm is the lowest in the table. Real data have no truth column; Step 6 gives the rule for them.
The data term is in m² and the curvature integral in m²/s³, so \(\lambda\) is in s³. Count time in milliseconds and the same fit needs a \(\lambda\) \(10^9\) times larger: a value from one data set does not carry over to the next.
zoom = (t >= 0.2) & (t <= 0.4)
t_fine = np.linspace(0.2, 0.4, 400)
h_fine_true = h0 - 0.5 * g * t_fine**2
s_lo = make_smoothing_spline(t, h_free, lam=1e-9)
s_hi = make_smoothing_spline(t, h_free, lam=1e-2)
dev = lambda f: 1e3 * (f(t_fine) - h_fine_true)          # deviation from the truth in mm

# a broken y axis: the near curves on top, the far one below
fig, (ax, ax_lo) = plt.subplots(2, 1, figsize=(7, 3.6), sharex=True,
                                gridspec_kw=dict(height_ratios=[3, 2], hspace=0.12))
ax.plot(t[zoom], 1e3 * (h_free - h_free_true)[zoom], "o", color=INK, ms=4)
ax.plot(t_fine, dev(s_lo), color=MUTED, lw=1.1)
ax.plot(t_fine, dev(spl), color=ACCENT)
ax_lo.plot(t_fine, dev(s_hi), color=MUTED, lw=1.1, ls=":")
ax.text(0.403, dev(spl)[-1], "GCV", color=ACCENT, va="center")
ax.text(0.256, 2.4, "λ = 1e-9", color=MUTED)
ax_lo.text(0.403, dev(s_hi)[-1], "λ = 1e-2", color=MUTED, va="center")
ax.set(ylim=(-2.5, 3.5), xlim=(0.195, 0.43))
ax_lo.set(ylim=(-21, -11), xlabel="t / s")
ax.spines["bottom"].set_visible(False)
ax.tick_params(bottom=False)
cut = dict(marker=[(-1, -0.5), (1, 0.5)], ms=10, ls="none", color=INK, mew=1, clip_on=False)
ax.plot([0], [0], transform=ax.transAxes, **cut)
ax_lo.plot([0], [1], transform=ax_lo.transAxes, **cut)
fig.supylabel("h − h_true / mm", fontsize=11)
plt.show()
Step 3: Differentiate the spline
A spline's derivative is again a spline, one degree lower, and derivative(nu) returns the nu-th one. Velocity and acceleration are two calls away:
v_spl = spl.derivative()(t)
a_spl = spl.derivative(2)(t)

v_fd = np.diff(h_free) / dt                # first difference, at the midpoints
t_fd = t[:-1] + dt / 2
print(f"velocity rms error: spline {rms(v_spl + g * t):.3f} m/s, first difference {rms(v_fd + g * t_fd):.3f} m/s")
print(f"acceleration 50 to 750 ms: mean {a_spl[mid].mean():.2f} m/s², rms error {rms(a_spl[mid] + g):.2f} m/s²")
print("first six values / (m/s²):", np.round(a_spl[:6], 2) + 0.0)

stiff = make_smoothing_spline(t, h_free, lam=3e-5)
a_stiff = stiff.derivative(2)(t)
print(f"lam=3e-5: residual {1e3 * rms(h_free - stiff(t)):.2f} mm, acceleration rms error {rms(a_stiff[mid] + g):.2f} m/s², "
      f"end values {abs(a_stiff[0]):.2f} and {abs(a_stiff[-1]):.2f} m/s²")
velocity rms error: spline 0.037 m/s, first difference 0.141 m/s
acceleration 50 to 750 ms: mean -9.86 m/s², rms error 1.00 m/s²
first six values / (m/s²): [  0.    -2.77  -4.91  -9.15 -10.39 -10.08]
lam=3e-5: residual 1.15 mm, acceleration rms error 0.48 m/s², end values 0.00 and 0.00 m/s²
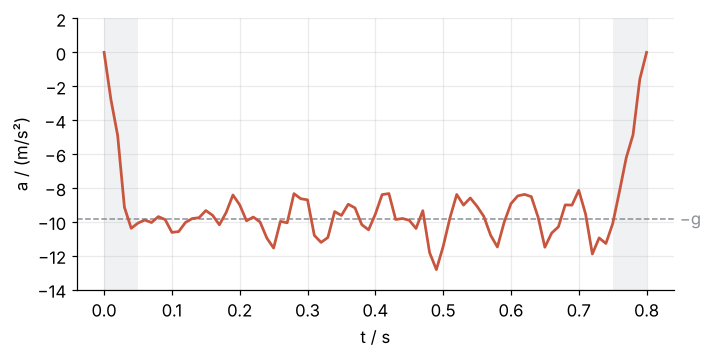
The velocity is four times better than the first difference, 0.037 against 0.141 m/s. The acceleration averages 9.86 m/s² in magnitude, but its rms error is 1.0 m/s², and the first values climb from exactly zero. The second derivative of a cubic is piecewise linear, so the acceleration is a polyline through the noise. The zeros come from the penalty in Step 1: \(\int f''^2\) is smallest when the curvature vanishes wherever no data hold it, so beyond the first and last sample the fit is a straight line, and \(f''\) is zero at both ends. That is the natural spline, and its pull reaches about 40 ms into the data. A stiffer fit, lam=3e-5, raises the residual from 0.86 to 1.15 mm and halves the interior error of the acceleration. Its ends stay at zero.
fig, ax = plt.subplots(figsize=(7, 3.2))
for span in [(0, 0.05), (0.75, 0.8)]:
    ax.axvspan(*span, color=MUTED, alpha=0.12, lw=0)
ax.axhline(-g, color=MUTED, lw=1, ls="--")
ax.plot(t, a_spl, color=ACCENT)
ax.text(1.01, -g, "−g", color=MUTED, va="center", transform=ax.get_yaxis_transform())   # just right of the axes
ax.set(xlabel="t / s", ylabel="a / (m/s²)", ylim=(-14, 2))
plt.show()
The cubic smoothing spline is the right tool for positions and velocity and a coarse one for acceleration.
Free account
The second half of this tutorial needs a free account
Sign in, or create an account with your email address, and the page goes on right here. The account costs nothing and also brings the notebook download, collections, and done marks.
Still to come
- Step 4: Go up to a quintic spline for the second derivative
- Step 5: Compare with finite differences and Savitzky-Golay
- Step 6: Choose s without the truth: the ball with air drag
- Pitfalls
- Variations
- Cheat sheet
- Further reading