Snowball Earth: why a dimmer sun freezes the planet and today's cannot thaw it
Afterwards you can explain the ice-albedo feedback, a tipping point, and hysteresis, and compute them with a one-dimensional energy balance model.
- Field
- Geology, Physics
- Prerequisites
- none beyond Python basics
- Libraries
matplotlib 3.11.2numpy 2.4.3pooch 1.9.0scipy 1.18.1
py-snowball-earth.ipynb, executed with the versions above. The download needs a free account
Run it yourself. In a terminal, this installs exactly the versions above:
pip install numpy==2.4.3 pooch==1.9.0 scipy==1.18.1 matplotlib==3.11.2 jupyterlabPlay: dim the sun over an ice-capped Earth
Sea ice reflects about 50 to 70 % of the sunlight that reaches it, and with snow on top up to 90 %; open ocean reflects about 6 %. A planet that grows ice therefore gets colder and grows more ice: the ice-albedo feedback, and the way the Earth could have turned into a Snowball Earth, white from pole to pole. The globe below runs an energy balance model of 90 latitude bands, each with its own temperature, under a sun at 100 % of today's. Turn the sun down one percent at a time with −, the slider, or the left arrow, and watch the ice line and the global mean temperature while 25 model years pass every second. Play/Pause (Space) stops the clock, and Reset (R) brings back today. Down to 88 % the ice caps creep toward the equator; at 87 % they race there. Then turn the sun back up to 100 % with +. Nothing melts, and the global mean stays at −36 °C.
Show code
// game.js: dim the sun over an ice-capped Earth. A 90-band energy balance model runs live; turn the sun
// down or up and watch the ice line and the global mean temperature. Units: °C, years, % of today's sun.
// The notebook writes the parameters, the grid, today's state, the coastline, and the land mask into #data.
"use strict";

const DATA = JSON.parse(document.getElementById("data").textContent);
const {A, B, C, D, Q0, S2, a0, a2, b0, Ts} = DATA.params;
const {xe, x, dt_yr: DT, years_per_s: SPEED, view: VIEW} = DATA;
const N = x.length;
const Q_MIN = Number(document.getElementById("sun").min), Q_MAX = Number(document.getElementById("sun").max);   // the slider's range
const dx = x.map((_, i) => xe[i + 1] - xe[i]);
const P2 = x.map((v) => (3 * v * v - 1) / 2);
const S = P2.map((p) => 1 + S2 * p);
const K = x.slice(1).map((_, i) => D * (1 - xe[i + 1] ** 2) / (x[i + 1] - x[i]));   // conductance of each inner edge
const EDGE_LAT = xe.map((v) => Math.round(Math.asin(v) * 180 / Math.PI));

// ---- the state: everything that changes, in one object
const state = {T: Float64Array.from(DATA.T0), q: 100, year: 0, running: true, trail: [], spin: 0};

// ---- one tick: formula 1 on the bands, by forward Euler
const flux = new Float64Array(N);
function step(T, q, dt) {
  flux.fill(0);
  for (let i = 0; i < N - 1; i++) {                     // heat across the edge between band i and band i + 1
    const F = K[i] * (T[i + 1] - T[i]);
    flux[i] += F;
    flux[i + 1] -= F;
  }
  for (let i = 0; i < N; i++) {
    const a = T[i] < Ts ? b0 : a0 + a2 * P2[i];         // coalbedo: the share of sunlight absorbed, less on ice
    T[i] += dt / C * (flux[i] / dx[i] + q / 100 * Q0 * S[i] * a - (A + B * T[i]));
  }
}

// ---- the readouts
const globalMean = (T) => T.reduce((sum, t, i) => sum + t * dx[i], 0) / 2;   // bands weighted by area
function iceLine(T) {                                   // equatorward edge of the lowest ice band in the north
  for (let i = N / 2; i < N; i++) if (T[i] < Ts) return EDGE_LAT[i];
  return 90;
}
const minus = (s) => s.replace("-", "−");
const iceText = (e) => e === 0 ? "frozen over" : e === 90 ? "no ice" : `ice line ${e}°`;

// ---- the land mask: 720 × 360 cells of 0.5°, one bit each, rows from 90° N, columns from 180° W
const MASK = (() => {
  const bytes = atob(DATA.mask.bits), bits = new Uint8Array(DATA.mask.w * DATA.mask.h);
  for (let i = 0; i < bits.length; i++) bits[i] = (bytes.charCodeAt(i >> 3) >> (7 - (i & 7))) & 1;
  return bits;
})();

// ---- drawing
const $ = (id) => document.getElementById(id);
const views = {globe: $("globe"), strip: $("strip")};
const raster = document.createElement("canvas");
let dpr = 1, pixels = null;

function colors() {
  const css = getComputedStyle(document.documentElement);
  return Object.fromEntries(["bg", "fg", "ink", "accent", "second", "muted", "ice", "coast"].map((k) => [k, css.getPropertyValue(`--${k}`).trim()]));
}
const rgb = (hex) => [1, 3, 5].map((i) => parseInt(hex.slice(i, i + 2), 16));
const mix = (bg, fg, alpha) => rgb(bg).map((b, i) => Math.round((1 - alpha) * b + alpha * rgb(fg)[i]));

function layout() {
  dpr = window.devicePixelRatio || 1;
  for (const canvas of Object.values(views)) {
    const box = canvas.getBoundingClientRect();
    canvas.width = Math.round(box.width * dpr);
    canvas.height = Math.round(box.height * dpr);
  }
  // Every pixel of the disk, mapped back to latitude and to longitude east of the view's center, once per size.
  const box = views.globe.getBoundingClientRect();
  const n = Math.max(2, Math.min(720, Math.round((Math.min(box.width, box.height) - 8) * dpr)));
  raster.width = raster.height = n;
  const p = VIEW.lat0 * Math.PI / 180;
  pixels = {n, inside: new Uint8Array(n * n), band: new Uint8Array(n * n), row: new Uint16Array(n * n), lon: new Float32Array(n * n)};
  for (let j = 0; j < n; j++) for (let i = 0; i < n; i++) {
    const u = 2 * (i + 0.5) / n - 1, v = 1 - 2 * (j + 0.5) / n, z2 = 1 - u * u - v * v, k = j * n + i;
    if (z2 <= 0) continue;
    const z = Math.sqrt(z2);
    const lat = Math.asin(v * Math.cos(p) + z * Math.sin(p)) * 180 / Math.PI;
    pixels.inside[k] = 1;
    pixels.band[k] = Math.min(N - 1, Math.floor((lat + 90) / 2));
    pixels.row[k] = Math.min(DATA.mask.h - 1, Math.floor((90 - lat) * 2));
    pixels.lon[k] = Math.atan2(u, z * Math.cos(p) - v * Math.sin(p)) * 180 / Math.PI;
  }
  render();
}

function begin(canvas) {                                // a 2D context in CSS pixels
  const ctx = canvas.getContext("2d");
  ctx.setTransform(dpr, 0, 0, dpr, 0, 0);
  return [ctx, canvas.width / dpr, canvas.height / dpr];
}

function drawGlobe(c, lon0, edge) {
  const [ctx, W, H] = begin(views.globe);
  ctx.fillStyle = c.bg;
  ctx.fillRect(0, 0, W, H);
  const R = Math.min(W, H) / 2 - 4, cx = W / 2, cy = H / 2;
  if (R < 10) return;
  // the raster: land from the mask, ice from the band's temperature
  const {n, inside, band, row, lon} = pixels, sea = mix(c.bg, c.second, 0.22), land = mix(c.bg, c.muted, 0.45), ice = rgb(c.ice);
  const rctx = raster.getContext("2d"), image = rctx.createImageData(n, n), px = image.data;
  for (let k = 0; k < n * n; k++) {
    if (!inside[k]) continue;
    const col = Math.floor((((lon[k] + lon0 + 180) % 360 + 360) % 360) * 2);
    const color = state.T[band[k]] < Ts ? ice : MASK[row[k] * DATA.mask.w + col] ? land : sea;
    px.set(color, 4 * k);
    px[4 * k + 3] = 255;
  }
  rctx.putImageData(image, 0, 0);
  ctx.drawImage(raster, cx - R, cy - R, 2 * R, 2 * R);

  // the orthographic projection forward: (lat, lon) to the disk, and whether the point faces the viewer
  const p = VIEW.lat0 * Math.PI / 180;
  const project = (lat, lng) => {
    const f = lat * Math.PI / 180, l = (lng - lon0) * Math.PI / 180;
    const X = Math.cos(f) * Math.cos(l), Y = Math.cos(f) * Math.sin(l), Z = Math.sin(f);
    return [cx + R * Y, cy - R * (Z * Math.cos(p) - X * Math.sin(p)), X * Math.cos(p) + Z * Math.sin(p) > 0];
  };
  const trace = (points) => {                           // a polyline, lifted wherever it goes behind the globe
    let down = false;
    for (const [lat, lng] of points) {
      const [u, v, front] = project(lat, lng);
      if (front && down) ctx.lineTo(u, v); else if (front) ctx.moveTo(u, v);
      down = front;
    }
  };
  ctx.strokeStyle = c.coast;
  ctx.lineWidth = 0.6;
  ctx.beginPath();
  for (const line of DATA.land) trace(Array.from({length: line.length / 2}, (_, i) => [line[2 * i + 1], line[2 * i]]));
  ctx.stroke();
  if (edge > 0 && edge < 90) {                          // the ice edge, in both hemispheres
    ctx.strokeStyle = c.accent;
    ctx.lineWidth = 2;
    ctx.beginPath();
    for (const lat of [edge, -edge]) trace(Array.from({length: 181}, (_, i) => [lat, 2 * i]));
    ctx.stroke();
  }
  ctx.strokeStyle = c.ink;
  ctx.lineWidth = 1;
  ctx.beginPath();
  ctx.arc(cx, cy, R, 0, 2 * Math.PI);
  ctx.stroke();
}

function drawStrip(c) {                                 // the player's path: ice line against the sun
  const [ctx, W, H] = begin(views.strip);
  ctx.fillStyle = c.bg;
  ctx.fillRect(0, 0, W, H);
  if (W < 80 || H < 60) return;
  const fs = parseFloat(getComputedStyle(document.body).fontSize);   // the page's text size, 14 px or more
  const m = {l: 2.4 * fs, r: 0.8 * fs, t: 2.3 * fs, b: 2.7 * fs}, w = W - m.l - m.r, h = H - m.t - m.b;
  const X = (q) => m.l + (q - Q_MIN) / (Q_MAX - Q_MIN) * w, Y = (e) => m.t + h - e / 90 * h;
  ctx.font = `${fs}px system-ui, sans-serif`;
  ctx.fillStyle = c.fg;
  ctx.strokeStyle = c.muted;
  ctx.lineWidth = 1;
  ctx.textBaseline = "top";
  for (let q = Math.ceil(Q_MIN / 20) * 20; q <= Q_MAX; q += 20) {   // labels at the ends align inward, clear of the 0
    ctx.textAlign = q === Q_MIN ? "left" : q === Q_MAX ? "right" : "center";
    ctx.fillText(q, X(q), m.t + h + 0.3 * fs);
  }
  ctx.textAlign = "center";
  ctx.fillText("sun / % of today", m.l + w / 2, m.t + h + 1.45 * fs);
  ctx.textAlign = "right";
  ctx.textBaseline = "middle";
  for (const e of [0, 30, 60, 90]) ctx.fillText(`${e}`, m.l - 0.4 * fs, Y(e));
  ctx.textAlign = "left";
  ctx.textBaseline = "top";
  ctx.fillText("ice line / °", 2, 0.4 * fs);
  ctx.globalAlpha = 0.25;
  ctx.beginPath();
  for (const e of [30, 60, 90]) { ctx.moveTo(m.l, Y(e)); ctx.lineTo(m.l + w, Y(e)); }
  ctx.stroke();
  ctx.globalAlpha = 1;
  ctx.beginPath();
  ctx.moveTo(m.l, m.t);
  ctx.lineTo(m.l, m.t + h);
  ctx.lineTo(m.l + w, m.t + h);
  ctx.stroke();
  ctx.fillStyle = c.accent;
  for (const [q, e] of state.trail) {
    ctx.beginPath();
    ctx.arc(X(q), Y(e), 2.5, 0, 2 * Math.PI);
    ctx.fill();
  }
  ctx.strokeStyle = c.accent;                           // where the planet is now
  ctx.lineWidth = 1.5;
  ctx.beginPath();
  ctx.arc(X(state.q), Y(iceLine(state.T)), 5, 0, 2 * Math.PI);
  ctx.stroke();
}

function render() {
  const c = colors(), edge = iceLine(state.T);
  drawGlobe(c, VIEW.lon0 - state.spin, edge);
  drawStrip(c);
  $("mean").textContent = `global mean ${minus(globalMean(state.T).toFixed(1))} °C`;
  $("ice").textContent = iceText(edge);
  $("year").textContent = `year ${Math.floor(state.year)}`;
  $("sun").value = state.q;
  $("sun-val").textContent = `${state.q} %`;
  $("play").textContent = state.running ? "Pause" : "Play";
}

// ---- controls, keys, and the loop
function set(partial) {
  if (partial.T) partial = {...partial, T: Float64Array.from(partial.T)};
  Object.assign(state, partial);
  render();
}
const clamp = (v) => Math.min(Q_MAX, Math.max(Q_MIN, v));
const nudge = (sign) => set({q: clamp(state.q + sign)});
const togglePlay = () => set({running: !state.running});
const reset = () => set({T: DATA.T0, q: 100, year: 0, trail: []});

$("sun").addEventListener("input", (e) => set({q: clamp(Number(e.target.value))}));
$("minus").addEventListener("click", () => nudge(-1));
$("plus").addEventListener("click", () => nudge(1));
$("play").addEventListener("click", togglePlay);
$("reset").addEventListener("click", reset);
document.addEventListener("keydown", (e) => {
  const actions = {" ": togglePlay, ArrowLeft: () => nudge(-1), ArrowRight: () => nudge(1), r: reset};
  const act = actions[e.key.length === 1 ? e.key.toLowerCase() : e.key];
  const native = (e.target instanceof HTMLInputElement && e.key.startsWith("Arrow"))
    || (e.target instanceof HTMLButtonElement && e.key === " ");   // the focused control handles these
  if (act && !native) {
    e.preventDefault();
    act();
  }
});

let last = null, owed = 0;
function frame(now) {                                   // called by the browser once per screen refresh
  const elapsed = last === null ? 0 : Math.min((now - last) / 1000, 0.05);   // capped: a background tab does not jump
  last = now;
  if (state.running) {
    state.spin = (state.spin + 360 * elapsed / VIEW.period_s) % 360;
    owed += SPEED * elapsed / DT;                       // model steps due: 25 years per second of play
    for (; owed >= 1; owed--) {
      step(state.T, state.q, DT);
      const before = state.year;
      state.year += DT;
      if (Math.floor(state.year / 2) > Math.floor(before / 2)) {   // a dot on the strip every 2 model years
        state.trail.push([state.q, iceLine(state.T)]);
        if (state.trail.length > 2000) state.trail.shift();
      }
    }
  }
  render();
  requestAnimationFrame(frame);
}

const resized = new ResizeObserver(layout);             // the boxes change with the frame and with the readouts
for (const id of ["globe-view", "strip-view"]) resized.observe($(id));
window.matchMedia("(prefers-color-scheme: dark)").addEventListener("change", render);
layout();
requestAnimationFrame(frame);
window.game = {state, set, render};
The ice line creeps, then jumps
Each press of − pushes the ice line toward the equator, further with every percent: from 72° at today's sun to 60° at 95 % and 38° at 88 %.
Show code
import base64
import json
from pathlib import Path

import numpy as np
import matplotlib.pyplot as plt
from matplotlib.colors import to_rgb
from matplotlib.path import Path as MplPath
import pooch
from scipy.optimize import brentq, minimize_scalar

plt.rcParams.update({
    "figure.figsize": (7, 3.6), "figure.dpi": 110,
    "axes.spines.top": False, "axes.spines.right": False,
    "axes.grid": True, "grid.alpha": 0.25,
    "font.size": 11, "lines.linewidth": 1.8,
})
INK, ACCENT, SECOND, MUTED = "#1f2a44", "#c8553d", "#2a7f9e", "#8a8f98"

# North, Cahalan, and Coakley (1981), Rev. Geophys. Space Phys. 19, 91: outgoing heat A + B T, today's
# sunlight Q0 spread as S(x) = 1 + S2 P2(x), coalbedo a0 + a2 P2(x) without ice and b0 on ice, ice below Ts.
A, B, Q0 = 203.3, 2.09, 335.0                       # W m⁻², W m⁻² °C⁻¹, W m⁻²
S2, a0, a2, b0, Ts = -0.477, 0.681, -0.202, 0.38, -10.0
D = 0.649                                           # W m⁻² °C⁻¹, NCC81's fit to today's pole-to-equator contrast
C = 1025 * 3985 * 50 / 3.15576e7                    # a 50 m ocean mixed layer, W yr m⁻² °C⁻¹

# 90 bands of 2° latitude: edges and centers in latitude phi and in x = sin(phi)
N = 90
phi_e = np.linspace(-90, 90, N + 1)
xe = np.sin(np.radians(phi_e))
xe[[0, -1]] = -1, 1
phi = (phi_e[:-1] + phi_e[1:]) / 2
x, dx = np.sin(np.radians(phi)), np.diff(xe)
P2 = (3 * x**2 - 1) / 2
S = 1 + S2 * P2

# Natural Earth 1:110m land, v5.1.2, public domain: coastlines to draw and a 0.5° land mask to paint
pooch.get_logger().setLevel("WARNING")              # no download message on the first run
path = pooch.retrieve(
    "https://raw.githubusercontent.com/nvkelso/natural-earth-vector/v5.1.2/geojson/ne_110m_land.geojson",
    known_hash="sha256:9e0729ee253ca7d7a5c4ae9395fb1902264c5377c52e224d13dd85010e2835d9",
)
with open(path, encoding="utf-8") as f:
    rings = [np.array(feature["geometry"]["coordinates"][0]) for feature in json.load(f)["features"]]
lon_m, lat_m = np.meshgrid(np.arange(-180, 180, 0.5) + 0.25, np.arange(90, -90, -0.5) - 0.25)
cells = np.column_stack([lon_m.ravel(), lat_m.ravel()])
land = np.zeros(len(cells), bool)
for ring in rings:
    (lon0, lat0), (lon1, lat1) = ring.min(axis=0), ring.max(axis=0)
    near = (cells[:, 0] >= lon0) & (cells[:, 0] <= lon1) & (cells[:, 1] >= lat0) & (cells[:, 1] <= lat1)
    land[near] |= MplPath(ring).contains_points(cells[near])
mask = land.reshape(360, 720)                       # rows from 90° N down, columns from 180° W east

# The coastline as lines: Antarctica's ring closes along 180° and 90° S, which is no coast
coast = []
for ring in rings:
    seam = (np.abs(ring[:-1, 0]) > 179.99) & (np.abs(ring[1:, 0]) > 179.99)
    pole = (ring[:-1, 1] < -89.99) & (ring[1:, 1] < -89.99)
    for part in np.split(np.arange(len(ring)), np.flatnonzero(seam | pole) + 1):
        if len(part) > 1:
            coast.append(ring[part])

share = np.sum(mask * np.cos(np.radians(lat_m))) / np.sum(np.cos(np.radians(lat_m)))
print(f"ne_110m_land.geojson, {Path(path).stat().st_size:,} bytes: {len(rings)} rings, {sum(map(len, rings)):,} vertices; "
      f"land {100 * share:.1f} % of the globe")
ne_110m_land.geojson, 138,160 bytes: 127 rings, 5,091 vertices; land 29.0 % of the globe
Each band balances the sunlight it absorbs against the heat it radiates to space, A + BT, linear in the surface temperature T, and heat diffuses from warm bands to cold ones. With x the sine of the latitude,
\(C\) is the heat capacity of a 50 m ocean layer, which sets only the speed, \(D\) the heat transport, and \(Q\,S(x)\) the sunlight, with \(S = 1 + S_2 P_2\) and \(P_2 = (3x^2 - 1)/2\) the simplest warm-equator, cold-pole shape. Equal steps in x cover equal areas, and \(1 - x^2\), the squared cosine of the latitude that diffusion on a sphere picks up in x, stops the flow at the poles. The coalbedo \(a\), the share of sunlight absorbed, is 0.70 on average above \(T_s = -10\) °C and 0.38 on ice, poleward of the ice line \(x_s\). Clouds included, ice reflects 0.62 and open water 0.30, not 0.06.
Below is the game's model in Python: diffusion builds L, formula 1's diffusion term as a matrix, and step is one tick. steady and q_of_edge turn the question around: they hold the ice line fixed and ask which sun keeps it there, a linear problem the hysteresis section solves. Here steady only gives today's start.
def diffusion(D):
    """The matrix L: across each inner edge the flux D(1 − x_e²)(T_{i+1} − T_i)/(x_{i+1} − x_i), per band width."""
    k = D * (1 - xe[1:-1]**2) / np.diff(x)
    return (np.diag(k, 1) + np.diag(k, -1) - np.diag(np.r_[k, 0] + np.r_[0, k])) / dx[:, None]

def coalbedo(T):
    return np.where(T < Ts, b0, a0 + a2 * P2)       # strictly below Ts is ice, as in game.js

def step(T, q, dt, L):
    """One tick of the game: formula 1 by forward Euler, with the sun q in % of today's."""
    return T + dt / C * (L @ T + q / 100 * Q0 * S * coalbedo(T) - (A + B * T))

def run(T, q, years, L, every=1.0):
    """Hold the sun at q for `years`; return the times and the states every `every` years."""
    n = max(1, round(every / dt))
    states = [T]
    for _ in range(round(years / (n * dt))):
        for _ in range(n):
            T = step(T, q, dt, L)
        states.append(T)
    return np.arange(len(states)) * n * dt, np.array(states)

def global_mean(T):
    return T @ dx / 2                               # each band weighted by its width in x, its share of the area

def ice_line(T):
    """The equatorward edge of the lowest ice band in the north, in °: 0 is frozen over, 90 no ice."""
    ice = np.flatnonzero(T[N // 2:] < Ts)
    return phi_e[N // 2 + ice[0]] if len(ice) else 90.0

def steady(q, phi_s, L, A=A):
    """Formula 4: the steady state with the ice line held at phi_s in both hemispheres."""
    lo, hi = np.sort(np.abs([xe[:-1], xe[1:]]), axis=0)
    ice = np.clip((hi - np.maximum(lo, np.sin(np.radians(phi_s)))) / (hi - lo), 0, 1)   # iced share of each band
    a = ice * b0 + (1 - ice) * (a0 + a2 * P2)
    return np.linalg.solve(L - B * np.eye(N), A - q / 100 * Q0 * S * a)

def q_of_edge(phi_s, L, A=A):
    """The sun in % at which an ice line at phi_s is steady. T is linear in q, so two solves give it."""
    x_s = np.sin(np.radians(phi_s))
    T_dark, T_now = (np.interp(x_s, x, steady(q, phi_s, L, A)) for q in (0, 100))
    return 100 * (Ts - T_dark) / (T_now - T_dark)

L = diffusion(D)
dt = 0.8 * 2 * C / np.abs(np.linalg.eigvals(L - B * np.eye(N))).max()
_, states = run(steady(100, 72, L), 100, 300, L)
T_today = states[-1]
print(f"D = {D:.3f} W m⁻² °C⁻¹, time step {dt * 365.25:.1f} days, 0.8 of the limit {dt / 0.8 * 365.25:.1f} days")
print(f"today, 100 %: ice line {ice_line(T_today):.0f}°, global mean {global_mean(T_today):.1f} °C, "
      f"equator {T_today[N // 2]:.1f} °C, pole {T_today[-1]:.1f} °C")
D = 0.649 W m⁻² °C⁻¹, time step 1.8 days, 0.8 of the limit 2.2 days
today, 100 %: ice line 72°, global mean 14.5 °C, equator 29.1 °C, pole -14.0 °C
North, Cahalan, and Coakley fitted D = 0.649 W m⁻² °C⁻¹ to the observed \(T_2 = -28\) °C in today's \(T = T_0 + T_2 P_2\), a pole 42 °C colder than the equator. The model's pole is 43.1 °C colder, with the ice line at 72° and a global mean of 14.5 °C.
Forward Euler is stable only for dt under twice the relaxation time of the fastest pattern, a zigzag from band to band; a longer step overshoots it by more each time. That limit, \(2C/|\lambda_{\max}|\) with \(\lambda_{\max}\) the eigenvalue of L − B largest in size, is 2.2 days (Finite differences derives it), and dt is 0.8 of it. The next cell dims the sun one percent every 150 model years.
down = {100: T_today}
for q in range(99, 87, -1):
    _, states = run(down[q + 1], q, 150, L)
    down[q] = states[-1]
for q in [100, 99, 95, 90, 89, 88]:
    print(f"sun {q:3d} %: ice line {ice_line(down[q]):2.0f}°, global mean {global_mean(down[q]):6.1f} °C")
t87, states87 = run(down[88], 87, 60, L, every=0.1)
line87 = np.array([ice_line(T) for T in states87])
print(f"from 88 % to 87 %: ice line at 20° after {t87[np.argmax(line87 <= 20)]:.0f} years, "
      f"frozen over after {t87[np.argmax(line87 == 0)]:.0f} years")
sun 100 %: ice line 72°, global mean   14.5 °C
sun  99 %: ice line 70°, global mean   13.2 °C
sun  95 %: ice line 60°, global mean    7.6 °C
sun  90 %: ice line 46°, global mean   -1.4 °C
sun  89 %: ice line 42°, global mean   -4.2 °C
sun  88 %: ice line 38°, global mean   -7.2 °C
from 88 % to 87 %: ice line at 20° after 39 years, frozen over after 42 years
Show code
def blend(color, alpha, bg="#ffffff"):
    return (1 - alpha) * np.array(to_rgb(bg)) + alpha * np.array(to_rgb(color))

SEA, LAND, ICE = blend(SECOND, 0.22), blend(MUTED, 0.45), np.array(to_rgb("#f4f6fa"))
VIEW = dict(lat0=25, lon0=20, period_s=30)          # the game's view: from 25° N, turning once every 30 s

def draw_globe(ax, T, lon0=VIEW["lon0"], n=360, pal=None, lw=1.0):
    """The game's globe in Matplotlib: land from the mask, ice from the band temperatures, the ice edge."""
    c = pal or dict(sea=SEA, land=LAND, ice=ICE, coast=INK, accent=ACCENT, limb=INK)
    p = np.radians(VIEW["lat0"])
    u, v = np.meshgrid(np.linspace(-1, 1, n), np.linspace(1, -1, n))
    z = np.sqrt(np.clip(1 - u**2 - v**2, 0, None))
    lat = np.degrees(np.arcsin(np.clip(v * np.cos(p) + z * np.sin(p), -1, 1)))
    lon = np.degrees(np.arctan2(u, z * np.cos(p) - v * np.sin(p))) + lon0
    row = np.clip(((90 - lat) * 2).astype(int), 0, 359)
    col = ((lon + 180) % 360 * 2).astype(int) % 720
    band = np.clip(((lat + 90) // 2).astype(int), 0, N - 1)
    rgb = np.where((T[band] < Ts)[..., None], c["ice"], np.where(mask[row, col][..., None], c["land"], c["sea"]))
    ax.imshow(np.dstack([rgb, u**2 + v**2 < 1]).astype(float), extent=(-1, 1, -1, 1))

    def project(lat, lon):                          # lifted (NaN) where the point is behind the globe
        f, l = np.radians(lat), np.radians(lon - lon0)
        X, Y, Z = np.cos(f) * np.cos(l), np.cos(f) * np.sin(l), np.sin(f)
        front = X * np.cos(p) + Z * np.sin(p) > 0
        return np.where(front, Y, np.nan), np.where(front, Z * np.cos(p) - X * np.sin(p), np.nan)

    for line in coast:
        ax.plot(*project(line[:, 1], line[:, 0]), color=c["coast"], lw=0.4 * lw)
    edge = ice_line(T)
    if 0 < edge < 90:
        for lat_s in [edge, -edge]:
            ax.plot(*project(np.full(361, lat_s), np.arange(361.0)), color=c["accent"], lw=1.4 * lw)
    ax.add_patch(plt.Circle((0, 0), 1, fill=False, color=c["limb"], lw=0.8 * lw))
    ax.set(xlim=(-1.03, 1.03), ylim=(-1.03, 1.03), aspect="equal")
    ax.set_axis_off()

def label(ax, text):
    ax.text(0.5, -0.04, text, transform=ax.transAxes, ha="center", va="top", color=INK)

def celsius(t, digits=1):
    return f"{t:.{digits}f} °C".replace("-", "−")
Show code
fig, axes = plt.subplots(1, 4, figsize=(7.5, 2.4), gridspec_kw=dict(wspace=0.08))
for ax, q in zip(axes[:3], [100, 95, 90]):
    draw_globe(ax, down[q])
    label(ax, f"{q} %\n{ice_line(down[q]):.0f}°, {celsius(global_mean(down[q]))}")
T50 = states87[np.argmin(np.abs(t87 - 50))]
draw_globe(axes[3], T50)
label(axes[3], f"87 %, 50 years later\nfrozen, {celsius(global_mean(T50), 0)}")
plt.show()
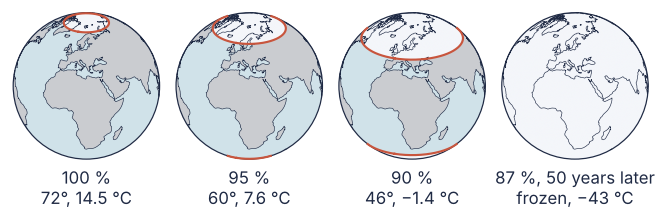
The caps speed up because a degree of ice near the equator covers more area and sunshine than one near the pole, so the cooling it adds outgrows the dimming behind it. Past some latitude no ice line can hold: a tipping point.
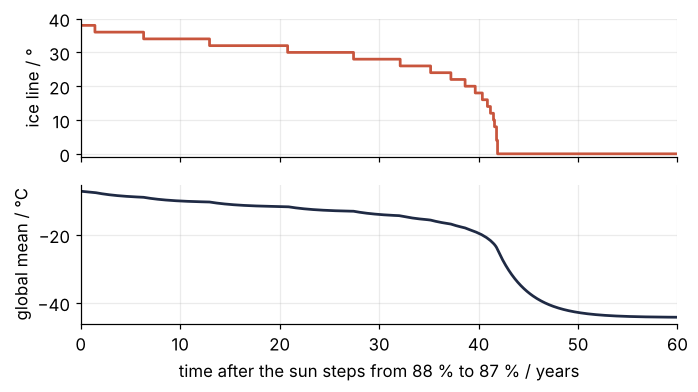
After the step from 88 % to 87 % the line creeps to 20° in 39 years and reaches the equator three years later. The bands flip whole, so the line moves in 2° steps.
Show code
fig, (ax1, ax2) = plt.subplots(2, 1, figsize=(7, 3.6), sharex=True)
ax1.step(t87, line87, where="post", color=ACCENT)
ax1.set(ylabel="ice line / °", ylim=(-1, 40), yticks=[0, 10, 20, 30, 40])
ax2.plot(t87, global_mean(states87), color=INK)
ax2.set(xlabel="time after the sun steps from 88 % to 87 % / years", ylabel="global mean / °C", xlim=(0, 60))
plt.show()
Free account
The second half of this tutorial needs a free account
Sign in, or create an account with your email address, and the page goes on right here. The account costs nothing and also brings the notebook download, collections, and done marks.
Still to come
- A frozen Earth stays frozen
- Same sun, different climate: hysteresis
- How the game computes it
- Variations
- Further reading