Fishery collapse: why a quota above the maximum sustainable yield is fatal
Afterwards you can explain why a fish quota above the maximum sustainable yield is fatal, why one below it can fail in bad years, and why fixed effort holds.
- Field
- Biology
- Prerequisites
- none beyond Python basics
- Libraries
matplotlib 3.11.2numpy 2.4.3
py-fishery-collapse.ipynb, executed with the versions above. The download needs a free account
Run it yourself. In a terminal, this installs exactly the versions above:
pip install numpy==2.4.3 matplotlib==3.11.2 jupyterlabPlay: run a fishery for fifty years
You are the fisheries minister for one stock of fish, and you decide how much of it the fleet may catch. Left alone, the sea would hold 1,000,000 t of this fish. The stock is at 500,000 t, where it grows by 125,000 t a year, more than at any other size: that is the maximum sustainable yield, the largest catch it can give year after year. The quota stands at 120,000 t a year. Press Play or Space and a year passes every 0.8 s. Change the quota with the slider, its − and + buttons, or the arrow keys; Boats (B) fixes the number of boats instead. Good and bad years (W) lets the weather change the growth, Reset (R) replays the fifty years with the same weather, so that two policies meet the same luck, and New years (N) takes the next of 20 weather sequences. Watch the fish, one for every 10,000 t, the boats, and the stock. Each year also adds a dot to the curve under the sea, which the sections below explain. Then set the quota to 130,000 t, 4 % above the maximum sustainable yield: the sea is empty in year 30.
Show code
// game.js: run a fishery for fifty years. Set a quota in tonnes a year or a number of boats,
// press Play, and watch the fish, the boats, and the stock. Units: tonnes and years.
// The notebook writes the parameters, the weather factors, and the growth curve into #data.
"use strict";

const DATA = JSON.parse(document.getElementById("data").textContent);
const {r: R, K, q: Q, years: YEARS, year_s: YEAR_S, fish_t: FISH_T} = DATA;
const MAX_FISH = 120, MAX_BOATS = 30;             // drawn at most; the readouts carry the real counts
const QUOTA_MAX = 200000, QUOTA_STEP = 5000, BOATS_MAX = 24;

// ---- the state: everything that changes, in one object
const state = {year: 0, stock: DATA.stock0, mode: "quota", quota: 120000, boats: 8, weather: false, set: 1,
  total: 0, running: false, history: [], previous: [], clock: 0, swim: 0};

// ---- Mulberry32, a public-domain seeded generator by Tommy Ettinger: the fish and boats start in the same places every time
function mulberry32(seed) {
  return () => {
    seed = (seed + 0x6d2b79f5) | 0;
    let t = Math.imul(seed ^ (seed >>> 15), seed | 1);
    t = (t + Math.imul(t ^ (t >>> 7), t | 61)) ^ t;
    return ((t ^ (t >>> 14)) >>> 0) / 4294967296;
  };
}
const rand = mulberry32(368);
const FISH = Array.from({length: MAX_FISH}, () => ({x: 2 * rand(), y: rand(), v: 0.02 + 0.04 * rand(), phase: 2 * Math.PI * rand()}));
const BOAT_X = Array.from({length: MAX_BOATS}, () => rand());

const clamp = (x, lo, hi) => Math.min(hi, Math.max(lo, x));
const tonnes = (x) => (Math.round(x / 100) * 100).toLocaleString("en-US");

// ---- one year: growth first, then the catch
function year() {
  const N = state.stock;
  const f = state.weather ? DATA.factors[state.set - 1][state.year] : 1;
  const grown = N + R * f * N * (1 - N / K);
  const C = state.mode === "quota" ? Math.min(state.quota, grown) : Q * state.boats * N;
  let next = Math.max(grown - C, 0);
  if (next < 1) next = 0;                               // less than a tonne left: collapsed
  state.history.push({stock: N, catch: C, mode: state.mode, f});
  state.total += C;
  state.stock = next;
  state.year += 1;
  if (state.year >= YEARS || next === 0) Object.assign(state, {running: false, clock: 0});
}

// In quota mode the boats are only a display: as many as it takes to land the quota.
const boatsOut = (s) => s.mode === "boats" ? s.boats : s.stock > 0 ? Math.ceil(s.quota / (Q * s.stock)) : 0;

// ---- drawing
const $ = (id) => document.getElementById(id);
const views = {sea: $("sea"), chart: $("chart")};
let dpr = 1;

function layout() {
  dpr = window.devicePixelRatio || 1;
  for (const canvas of Object.values(views)) {
    const box = canvas.getBoundingClientRect();
    canvas.width = Math.round(box.width * dpr);
    canvas.height = Math.round(box.height * dpr);
  }
  render();
}

function colors() {
  const css = getComputedStyle(document.documentElement);
  return Object.fromEntries(["bg", "fg", "ink", "accent", "second", "muted"].map((k) => [k, css.getPropertyValue(`--${k}`).trim()]));
}

function begin(canvas) {                                // a 2D context in CSS pixels
  const ctx = canvas.getContext("2d");
  ctx.setTransform(dpr, 0, 0, dpr, 0, 0);
  return [ctx, canvas.width / dpr, canvas.height / dpr];
}

function drawSea(c) {
  const [ctx, W, H] = begin(views.sea);
  const surface = Math.min(0.2 * H, Math.max(44, 0.12 * H)), quay = 0.08 * W;   // a strip of sky for the boats and the status
  ctx.fillStyle = c.bg;
  ctx.fillRect(0, 0, W, H);
  ctx.fillStyle = c.second;
  ctx.globalAlpha = 0.14;
  ctx.fillRect(0, surface, W, H - surface);
  ctx.globalAlpha = 0.18;
  ctx.fillRect(0, surface, W, 0.06 * H);                // the darker band under the surface
  ctx.globalAlpha = 1;
  ctx.fillStyle = c.muted;
  ctx.fillRect(0, surface - 0.05 * H, quay, H - surface + 0.05 * H);

  // fish: one per FISH_T tonnes; when the stock falls the last ones in the list go, so nothing jumps
  const n = Math.min(MAX_FISH, Math.round(state.stock / FISH_T));
  const x0 = quay + 0.04 * W, w = W - x0 - 0.04 * W, y0 = surface + 0.12 * H, h = H - y0 - 0.08 * H;
  const L = clamp(W / 18, 12, 30);                     // fish length in CSS pixels
  ctx.fillStyle = c.ink;
  for (const fish of FISH.slice(0, n)) {
    const u = (fish.x + fish.v * state.swim) % 2;       // 0 to 1 swimming right, 1 to 2 swimming back
    const dir = u < 1 ? 1 : -1;
    const x = x0 + (u < 1 ? u : 2 - u) * w, y = y0 + (fish.y + 0.03 * Math.sin(fish.phase + 0.8 * state.swim)) * h;
    const s = L / 2.5;
    ctx.beginPath();                                    // one path per fish: overlapping fish stay filled
    ctx.moveTo(x + s, y);
    ctx.ellipse(x, y, s, 0.4 * s, 0, 0, 2 * Math.PI);
    ctx.moveTo(x - dir * 0.8 * s, y);
    ctx.lineTo(x - dir * 1.5 * s, y - 0.45 * s);
    ctx.lineTo(x - dir * 1.5 * s, y + 0.45 * s);
    ctx.closePath();
    ctx.fill();
  }

  // boats: out in the first fifth of the year, fishing, back in the last fifth
  const p = state.clock / YEAR_S, out = state.running ? clamp(Math.min(p, 1 - p) / 0.2, 0, 1) : 0;
  const all = boatsOut(state), shown = Math.min(all, MAX_BOATS), B = clamp(W / 24, 14, 26);
  ctx.fillStyle = c.ink;
  for (let i = 0; i < shown; i++) {
    const home = quay + 0.6 * B + (i % 10) * 0.25 * B;
    const x = home + out * (x0 + BOAT_X[i] * w - home), y = surface + 1.5 * Math.sin(2 * state.swim + i);
    ctx.beginPath();
    ctx.moveTo(x - B / 2, y);
    ctx.lineTo(x - 0.15 * B, y);
    ctx.lineTo(x - 0.15 * B, y - 0.3 * B);
    ctx.lineTo(x + 0.1 * B, y - 0.3 * B);
    ctx.lineTo(x + 0.1 * B, y);
    ctx.lineTo(x + B / 2, y);
    ctx.lineTo(x + 0.35 * B, y + 0.25 * B);
    ctx.lineTo(x - 0.35 * B, y + 0.25 * B);
    ctx.fill();
  }
  ctx.font = "15px system-ui, sans-serif";
  ctx.textBaseline = "middle";
  if (all > MAX_BOATS) ctx.fillText(`+${all - MAX_BOATS} boats`, quay + 6, surface / 2);   // beside the quay, above the boats
  ctx.textAlign = "right";
  ctx.fillText(statusText(), W - 6, surface / 2);
  ctx.textAlign = "left";
}

function statusText() {
  if (state.stock === 0) return "The stock has collapsed";
  if (state.year >= YEARS) return `Fifty years: ${(state.total / 1e6).toFixed(2)} million t caught`;
  const last = state.history[state.history.length - 1];
  if (last && last.f < 0.62) return `A bad year: growth ×${last.f.toFixed(2)}`;
  if (last && last.f > 1.38) return `A good year: growth ×${last.f.toFixed(2)}`;
  return "";
}

function drawChart(c) {
  const [ctx, W, H] = begin(views.chart);
  ctx.fillStyle = c.bg;
  ctx.fillRect(0, 0, W, H);
  if (W < 50 || H < 50) return;
  const m = {l: 40, r: 20, t: 28, b: 36}, w = W - m.l - m.r, h = H - m.t - m.b;
  const X = (N) => m.l + (N / K) * w, Y = (C) => m.t + h - (C / 200000) * h;   // stock along, catch up
  ctx.font = "14px system-ui, sans-serif";
  ctx.lineWidth = 1;
  ctx.strokeStyle = c.muted;
  ctx.fillStyle = c.fg;
  ctx.textAlign = "center";
  ctx.textBaseline = "top";
  for (const [N, text] of [[0, "0"], [5e5, "500"], [1e6, "1,000"]]) ctx.fillText(text, X(N), m.t + h + 3);
  ctx.fillText("stock / 1,000 t", m.l + w / 2, m.t + h + 19);
  ctx.textAlign = "right";
  ctx.textBaseline = "middle";
  for (const [C, text] of [[0, "0"], [1e5, "100"], [2e5, "200"]]) ctx.fillText(text, m.l - 5, Y(C));
  ctx.textAlign = "left";
  ctx.fillText("catch / 1,000 t per yr", 4, 9);
  ctx.globalAlpha = 0.25;
  ctx.beginPath();
  for (const C of [1e5, 2e5]) { ctx.moveTo(m.l, Y(C)); ctx.lineTo(m.l + w, Y(C)); }
  ctx.stroke();
  ctx.globalAlpha = 1;
  ctx.beginPath();
  ctx.moveTo(m.l, m.t);
  ctx.lineTo(m.l, m.t + h);
  ctx.lineTo(m.l + w, m.t + h);
  ctx.stroke();

  ctx.save();
  ctx.beginPath();
  ctx.rect(m.l, m.t - 6, w + 6, h + 6);
  ctx.clip();
  // the growth curve: left half dashed (unstable under a quota), right half solid (stable)
  for (const right of [false, true]) {
    ctx.beginPath();
    DATA.curve.filter(([N]) => right === (N >= K / 2)).forEach(([N, g], i) => (i ? ctx.lineTo : ctx.moveTo).call(ctx, X(N), Y(g)));
    ctx.strokeStyle = right ? c.ink : c.muted;
    ctx.lineWidth = 1.8;
    ctx.setLineDash(right ? [] : [5, 4]);
    ctx.stroke();
  }
  ctx.setLineDash([]);
  // the current policy, in the color of its dots: a quota is a horizontal line, a fleet a line through the origin
  ctx.strokeStyle = state.mode === "quota" ? c.accent : c.second;
  ctx.lineWidth = 1;
  ctx.beginPath();
  if (state.mode === "quota") { ctx.moveTo(X(0), Y(state.quota)); ctx.lineTo(X(K), Y(state.quota)); }
  else { ctx.moveTo(X(0), Y(0)); ctx.lineTo(X(K), Y(Q * state.boats * K)); }
  ctx.stroke();
  // one dot per year at (stock, catch); the previous run faint
  for (const [list, alpha] of [[state.previous, 0.3], [state.history, 1]]) {
    ctx.globalAlpha = alpha;
    for (const e of list) {
      ctx.fillStyle = e.mode === "quota" ? c.accent : c.second;
      ctx.beginPath();
      ctx.arc(X(e.stock), Y(e.catch), 3, 0, 2 * Math.PI);
      ctx.fill();
    }
  }
  ctx.globalAlpha = 1;
  ctx.restore();
  ctx.fillStyle = c.ink;
  ctx.beginPath();
  ctx.arc(X(K / 2), Y(DATA.msy), 3.5, 0, 2 * Math.PI);
  ctx.fill();
  ctx.textAlign = "center";
  ctx.textBaseline = "bottom";
  ctx.lineWidth = 4;                                    // a halo in the background color keeps the label
  ctx.strokeStyle = c.bg;                               // readable when a policy line runs through it
  ctx.strokeText("MSY", X(K / 2), Y(DATA.msy) - 5);
  ctx.fillText("MSY", X(K / 2), Y(DATA.msy) - 5);
}

function render() {
  const c = colors();
  drawSea(c);
  drawChart(c);
  const last = state.history[state.history.length - 1];
  $("year").textContent = `Year ${state.year} of ${YEARS}`;
  $("stock").textContent = `Stock ${tonnes(state.stock)} t`;
  $("catch").textContent = `Catch ${tonnes(last ? last.catch : 0)} t`;
  $("total").textContent = `Total ${(state.total / 1e6).toFixed(2)} million t`;
  $("boats").textContent = `Boats ${boatsOut(state)}`;
  $("growth").textContent = `Growth +${tonnes(R * state.stock * (1 - state.stock / K))} t`;
  const quota = state.mode === "quota";
  $("quota-mode").setAttribute("aria-pressed", quota);
  $("boats-mode").setAttribute("aria-pressed", !quota);
  $("weather").setAttribute("aria-pressed", state.weather);
  $("knob-label").textContent = quota ? "Quota" : "Boats";
  Object.assign($("knob"), quota ? {max: QUOTA_MAX / 1000, step: QUOTA_STEP / 1000} : {max: BOATS_MAX, step: 1});
  $("knob").value = quota ? state.quota / 1000 : state.boats;
  $("knob-val").textContent = quota ? `${tonnes(state.quota)} t/yr` : `${state.boats} boats`;
  $("play").textContent = state.running ? "Pause" : "Play";
  $("next").textContent = `New years (${state.set} of 20)`;
}

// ---- controls, keys, and the loop
function set(partial) {
  Object.assign(state, partial);
  render();
}

function setMode(mode) {                                // carry last year's catch over to the new policy
  const last = state.history[state.history.length - 1];
  if (mode !== state.mode && last && state.stock > 0) {
    if (mode === "boats") state.boats = clamp(Math.round(last.catch / (Q * state.stock)), 0, BOATS_MAX);
    else state.quota = clamp(Math.round(last.catch / QUOTA_STEP) * QUOTA_STEP, 0, QUOTA_MAX);
  }
  set({mode});
}

function nudge(sign) {                                  // − and +, and the arrow keys
  if (state.mode === "quota") set({quota: clamp(state.quota + sign * QUOTA_STEP, 0, QUOTA_MAX)});
  else set({boats: clamp(state.boats + sign, 0, BOATS_MAX)});
}

const reset = () => set({year: 0, stock: DATA.stock0, total: 0, running: false, clock: 0,
  previous: state.history.length ? state.history : state.previous, history: []});
const togglePlay = () => set({running: !state.running && state.year < YEARS && state.stock > 0});
const newYears = () => { set({set: state.set % 20 + 1, weather: true}); reset(); };

$("quota-mode").addEventListener("click", () => setMode("quota"));
$("boats-mode").addEventListener("click", () => setMode("boats"));
$("weather").addEventListener("click", () => set({weather: !state.weather}));
$("knob").addEventListener("input", (e) => {
  const v = Number(e.target.value);
  set(state.mode === "quota" ? {quota: v * 1000} : {boats: v});
});
$("minus").addEventListener("click", () => nudge(-1));
$("plus").addEventListener("click", () => nudge(1));
$("play").addEventListener("click", togglePlay);
$("reset").addEventListener("click", reset);
$("next").addEventListener("click", newYears);
document.addEventListener("keydown", (e) => {
  const actions = {" ": togglePlay, ArrowLeft: () => nudge(-1), ArrowRight: () => nudge(1), q: () => setMode("quota"),
    b: () => setMode("boats"), w: () => set({weather: !state.weather}), r: reset, n: newYears};
  const act = actions[e.key.length === 1 ? e.key.toLowerCase() : e.key];
  const native = (e.target instanceof HTMLInputElement && e.key.startsWith("Arrow"))
    || (e.target instanceof HTMLButtonElement && e.key === " ");   // the focused control handles these
  if (act && !native) {
    e.preventDefault();
    act();
  }
});

let last = null;
function frame(now) {                                   // called by the browser once per screen refresh
  const dt = last === null ? 0 : Math.min((now - last) / 1000, 0.05);   // capped: a background tab does not jump
  last = now;
  state.swim += dt;
  if (state.running) {
    state.clock += dt;
    if (state.clock >= YEAR_S) {
      state.clock -= YEAR_S;
      year();
    }
  }
  render();
  requestAnimationFrame(frame);
}

window.addEventListener("resize", layout);
layout();
requestAnimationFrame(frame);
window.game = {state, set, render};
Half a full sea grows the most fish
Set the quota to 0 and the stock climbs back toward 1,000,000 t: slowly at first, fastest near half full, slowly again near the top. The growth readout peaks at +125,000 t a year near 500,000 t.
The stills come from hidden cells that run the game's rules in Python, under the same names as in game.js.
Show code
import json
from pathlib import Path

import numpy as np
import matplotlib.pyplot as plt
from matplotlib.collections import PolyCollection

plt.rcParams.update({
    "figure.figsize": (7, 3.6), "figure.dpi": 110,
    "axes.spines.top": False, "axes.spines.right": False,
    "axes.grid": True, "grid.alpha": 0.25,
    "font.size": 11, "lines.linewidth": 1.8,
})
INK, ACCENT, SECOND, MUTED = "#1f2a44", "#c8553d", "#2a7f9e", "#8a8f98"

R, K, Q = 0.5, 1_000_000, 0.025      # growth rate / yr, carrying capacity / t, share of the stock one boat takes / yr
N0, YEARS, YEAR_S = 500_000, 50, 0.8  # start / t, years of play, seconds of play per year
SIGMA, FISH_T = 0.4, 10_000           # spread of the weather, tonnes per fish drawn
MSY = R * K / 4

# The weather: each year's growth rate is R times f = exp(σz − σ²/2), which averages 1. Rounded once,
# so that the notebook and the game use the same numbers; the game gets the first 20 sequences.
Z = np.random.default_rng(368).standard_normal((1000, YEARS))
FACTORS = np.round(np.exp(SIGMA * Z - SIGMA**2 / 2), 3)

# ---- the game's rules, same names as in game.js
def year_step(N, mode, value, f=1.0):
    """One year, growth first and then the catch. value is the quota in t or the number of boats."""
    grown = N + R * f * N * (1 - N / K)
    C = np.minimum(value, grown) if mode == "quota" else Q * value * N
    N_next = np.maximum(grown - C, 0.0)
    return np.where(N_next < 1, 0.0, N_next), C      # less than a tonne left: collapsed

def play(mode, value, stock=N0, years=YEARS, factors=None, switch=None):
    """Stock at the start of each year (years + 1 values) and catch of each year. factors: one weather
    sequence, or many as rows, all played at once. switch: (year, new value), a change of policy."""
    rows = () if factors is None or np.ndim(factors) == 1 else (len(factors),)
    N, C = np.zeros(rows + (years + 1,)), np.zeros(rows + (years,))
    N[..., 0] = stock
    for t in range(years):
        if switch and t == switch[0]:
            value = switch[1]
        f = 1.0 if factors is None else factors[..., t]
        N[..., t + 1], C[..., t] = year_step(N[..., t], mode, value, f)
    return N, C

def boats_out(mode, value, N):
    """The fleet, or in quota mode as many boats as it takes to land the quota."""
    return value if mode == "boats" else int(np.ceil(value / (Q * N))) if N > 0 else 0

def steady_states(H):
    """The two stocks at which growth equals a quota H, lower first; NaN above the MSY."""
    root = np.sqrt(1 - 4 * H / (R * K)) if H <= MSY else np.nan
    return K / 2 * (1 - root), K / 2 * (1 + root)

def yearly_factor(N_star, mode, value):
    """Start 1 t above the steady state N_star, run one calm year, return the gap then."""
    return float(year_step(N_star + 1, mode, value)[0]) - N_star

# ---- the game's seeded generator, bit for bit, so that the stills put fish and boats where the game does
def mulberry32(seed):
    def rand():
        nonlocal seed
        seed = (seed + 0x6D2B79F5) & 0xFFFFFFFF
        t = (seed ^ (seed >> 15)) * (seed | 1) & 0xFFFFFFFF
        t = ((t + ((t ^ (t >> 7)) * (t | 61) & 0xFFFFFFFF)) & 0xFFFFFFFF) ^ t
        return (t ^ (t >> 14)) / 4294967296
    return rand

rand = mulberry32(368)
FISH = [dict(x=2 * rand(), y=rand(), v=0.02 + 0.04 * rand(), phase=2 * np.pi * rand()) for _ in range(120)]
BOAT_X = [rand() for _ in range(30)]

def draw_scene(ax, stock, boats=0, label=None):
    """The game's sea at swim time 0, mid-year with the boats out, in the game's coordinates (y down)."""
    W, H = 1.6, 1.0
    surface, quay = 0.2 * H, 0.08 * W
    ax.set_axis_off()
    ax.set(xlim=(0, W), ylim=(H, 0), aspect="equal")
    ax.add_patch(plt.Rectangle((0, surface), W, H - surface, color=SECOND, alpha=0.14, lw=0))
    ax.add_patch(plt.Rectangle((0, surface), W, 0.06 * H, color=SECOND, alpha=0.18, lw=0))
    ax.add_patch(plt.Rectangle((0, surface - 0.05 * H), quay, H - surface + 0.05 * H, color=MUTED, lw=0))
    x0, y0 = quay + 0.04 * W, surface + 0.12 * H
    w, h = W - x0 - 0.04 * W, H - y0 - 0.08 * H
    s, t = W / 14 / 2.5, np.linspace(0, 2 * np.pi, 25)       # fish a little longer than the game's W / 18: a still is small
    shapes = []
    for fish in FISH[:min(len(FISH), round(stock / FISH_T))]:
        u = fish["x"] % 2
        d = 1 if u < 1 else -1                        # swimming right or back
        x, y = x0 + (u if u < 1 else 2 - u) * w, y0 + (fish["y"] + 0.03 * np.sin(fish["phase"])) * h
        shapes.append(np.column_stack([x + s * np.cos(t), y + 0.4 * s * np.sin(t)]))
        shapes.append([(x - d * 0.8 * s, y), (x - d * 1.5 * s, y - 0.45 * s), (x - d * 1.5 * s, y + 0.45 * s)])
    hull = np.array([(-0.5, 0), (-0.15, 0), (-0.15, -0.3), (0.1, -0.3), (0.1, 0), (0.5, 0), (0.35, 0.25), (-0.35, 0.25)])
    shapes += [hull * W / 20 + (x0 + BOAT_X[i] * w, surface) for i in range(min(boats, 30))]
    ax.add_collection(PolyCollection(shapes, facecolors=INK, linewidths=0))
    if label:
        ax.text(W - 0.01, surface / 2, label, color=INK, ha="right", va="center")

def draw_diagram(ax, runs=(), quotas=(), fleets=(), msy_label="MSY", msy_at=(0, 7)):
    """The game's diagram: the growth parabola, policy lines, and one dot per year at (stock, catch).
    runs: (stock, catch, color, alpha); quotas: (H, color); fleets: (boats, color). Axes in 1,000 t.
    msy_at: where the MSY label sits, in points from the dot; msy_label=None leaves it out."""
    N = np.linspace(0, K, 201)
    g = R * N * (1 - N / K)
    left = N <= K / 2
    ax.plot(N[left] / 1e3, g[left] / 1e3, color=MUTED, ls="--")
    ax.plot(N[~left | (N == K / 2)] / 1e3, g[~left | (N == K / 2)] / 1e3, color=INK)
    for H, color in quotas:
        ax.axhline(H / 1e3, color=color, lw=1)
    for B, color in fleets:
        ax.plot([0, K / 1e3], [0, Q * B * K / 1e3], color=color, lw=1)
    for stock, catch, color, alpha in runs:
        ax.plot(stock[:len(catch)] / 1e3, catch / 1e3, "o", ms=4, color=color, alpha=alpha, zorder=3)
    ax.plot(K / 2e3, MSY / 1e3, "o", ms=6, color=INK, zorder=4)
    if msy_label:
        ax.annotate(msy_label, (K / 2e3, MSY / 1e3), xytext=msy_at, textcoords="offset points", ha="center",
                    va="bottom" if msy_at[1] > 0 else "top", color=INK)
    ax.set(xlabel="stock / 1,000 t", ylabel="catch / 1,000 t per yr", xlim=(0, 1000), ylim=(0, 200),
           xticks=[0, 250, 500, 750, 1000], yticks=[0, 50, 100, 150, 200])

print(f"r = {R} per yr, K = {K:,} t, MSY = rK/4 = {MSY:,.0f} t per yr, start {N0:,} t")
print(f"weather: {FACTORS.shape[0]} sequences of {FACTORS.shape[1]} years; f < 0.62 in {np.mean(FACTORS < 0.62):.1%} "
      f"of years, f > 1.38 in {np.mean(FACTORS > 1.38):.1%}")
r = 0.5 per yr, K = 1,000,000 t, MSY = rK/4 = 125,000 t per yr, start 500,000 t
weather: 1000 sequences of 50 years; f < 0.62 in 16.0% of years, f > 1.38 in 15.7%
Show code
stocks = np.array([100_000, 500_000, 900_000])
growth = R * stocks * (1 - stocks / K)
fig = plt.figure(figsize=(7, 5.2))
grid = fig.add_gridspec(2, 3, height_ratios=[1, 1.6], hspace=0.12, wspace=0.06)
for j, (N, G) in enumerate(zip(stocks, growth)):
    ax = fig.add_subplot(grid[0, j])
    draw_scene(ax, N, label=f"+{G:,.0f} t a yr")
    ax.text(0.8, 1.04, f"{N:,} t", color=MUTED, ha="center", va="top")
ax = fig.add_subplot(grid[1, :])
draw_diagram(ax, msy_label=f"MSY {MSY:,.0f} t a yr at {K // 2:,} t")
ax.set(ylabel="growth / 1,000 t per yr")
ax.plot(stocks / 1e3, growth / 1e3, "o", ms=6, color=INK, zorder=4)
plt.show()
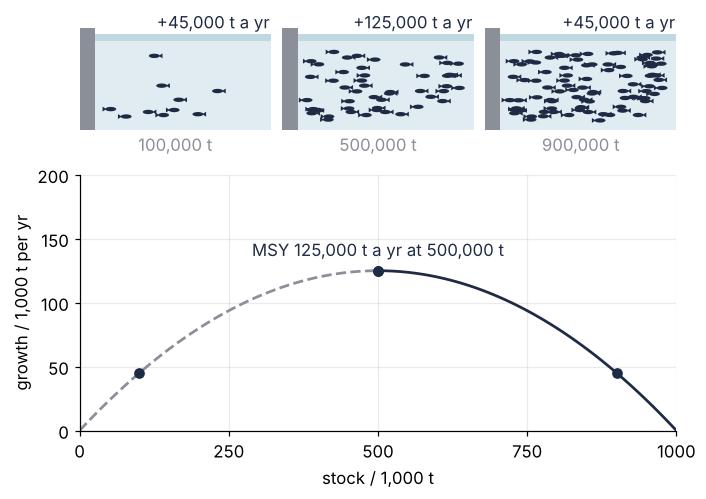
Each year the stock grows, then the catch is taken. Growth is r·N, the young of N tonnes of parents, times 1 − N/K, the share of room and food still free: a few fish make few young, and a full sea has no room for more. With the stock N in tonnes, the growth rate r = 0.5 a year, the carrying capacity K = 1,000,000 t, the catch C, and a weather factor f that is 1 in a calm year,
Fisheries scientists call this the Schaefer surplus production model. Its growth term is a parabola in N, highest at N = K/2, where it is rK/4. That growth is what a catch can take every year without shrinking the stock: the maximum sustainable yield, MSY for short. Every picture on this page has stock along the bottom and growth or catch per year up the side; the curve under the game's sea is this parabola.
play runs the rule for as many years as you ask and returns the stock at the start of each year and the catch of each:
for N in [100_000, 500_000, 900_000]:
    print(f"stock {N:>7,} t   growth {R * N * (1 - N / K):>7,.0f} t per yr")
N = np.linspace(0, K, 1001)
g = R * N * (1 - N / K)
print(f"largest growth {g.max():,.0f} t per yr, at {N[g.argmax()]:,.0f} t")
stock, _ = play("quota", 0, stock=100_000, years=10)
print("unfished from 100,000 t: " + ", ".join(f"{stock[t]:,.0f} t after {t} yr" for t in [5, 8, 10]))
stock 100,000 t   growth  45,000 t per yr
stock 500,000 t   growth 125,000 t per yr
stock 900,000 t   growth  45,000 t per yr
largest growth 125,000 t per yr, at 500,000 t
unfished from 100,000 t: 510,959 t after 5 yr, 844,997 t after 8 yr, 951,236 t after 10 yr
A sea nine tenths full makes no more fish than one a tenth full, 45,000 t a year each, and a half-full sea makes nearly three times as many. Unfished from 100,000 t, the stock reaches 511,000 t in five years and 951,000 t in ten.
A quota just above the yield empties the sea
At 130,000 t the full catch lands every year, and for a decade nothing looks wrong: the stock loses 54,000 t in ten years. Then the fish thin out faster, the harbor sends out more boats for the same catch, and in year 30 the sea is empty.
Show code
stock_130, catch_130 = play("quota", 130_000)
stock_120, catch_120 = play("quota", 120_000)
fig = plt.figure(figsize=(7, 5.2))
grid = fig.add_gridspec(2, 3, height_ratios=[1, 1.6], hspace=0.12, wspace=0.06)
for j, t in enumerate([0, 20, 28]):
    ax = fig.add_subplot(grid[0, j])
    boats = boats_out("quota", 130_000, stock_130[t])
    draw_scene(ax, stock_130[t], boats, label=f"{boats} boats")
    ax.text(0.8, 1.04, f"year {t}, {stock_130[t]:,.0f} t", color=MUTED, ha="center", va="top")
ax = fig.add_subplot(grid[1, :])
draw_diagram(ax, runs=[(stock_120, catch_120, ACCENT, 0.3), (stock_130[:31], catch_130[:30], ACCENT, 1)],
             quotas=[(130_000, ACCENT)], msy_at=(0, -9))
ax.annotate("130,000 t: dots run left", (300, 130), xytext=(300, 165), ha="center", color=ACCENT,
            arrowprops=dict(arrowstyle="->", color=MUTED, lw=1))
ax.annotate("120,000 t", (600, 120), xytext=(760, 165), ha="center", color=ACCENT,
            arrowprops=dict(arrowstyle="->", color=MUTED, lw=1))
plt.show()
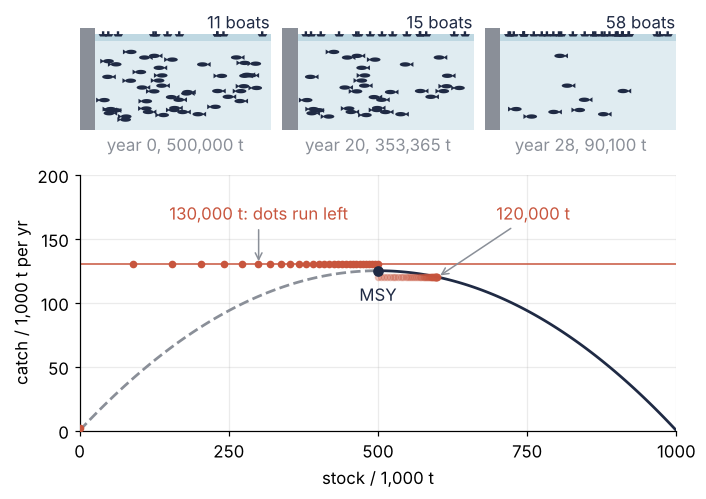
A fixed quota takes the same tonnage at any stock, a horizontal line at height H on the first picture's axes. The stock holds steady where the line meets the parabola, because there growth replaces the catch exactly. Below rK/4 they meet twice, at
Right of the upper crossing the quota exceeds growth and the stock falls back; left of it growth wins and the stock climbs back: a stable steady state. At the lower crossing it is the other way around, and a stock just below it loses more every year. Push the stock 1 t off a steady state and run one year: the gap is multiplied by a number, the yearly factor, the same every year while the gap is small. Below 1 the gap shrinks, above 1 it grows. steady_states returns the two crossings, lower first; yearly_factor makes the 1 t test:
for H in [100_000, 120_000, 125_000, 130_000]:
    low, high = steady_states(H)
    print(f"quota {H:,} t: " + ("no steady state" if np.isnan(low) else f"steady states {low:,.0f} t and {high:,.0f} t"))
low, high = steady_states(120_000)
print(f"yearly factor at 120,000 t: {yearly_factor(high, 'quota', 120_000):.3f} at the upper, "
      f"{yearly_factor(low, 'quota', 120_000):.3f} at the lower")

zero = np.argmax(stock_130 == 0)
print(f"130,000 t: loses {stock_130[0] - stock_130[1]:,.0f} t in year 1, {stock_130[1] - stock_130[2]:,.0f} t in year 2; "
      f"{stock_130[10]:,.0f} t after 10 yr, {stock_130[20]:,.0f} t after 20, zero after {zero}")
print(f"catch over 50 yr: 130,000 t quota {catch_130.sum() / 1e6:.2f} million t, "
      f"120,000 t quota {catch_120.sum() / 1e6:.2f} million t (stock {stock_120[-1]:,.0f} t at the end)")
quota 100,000 t: steady states 276,393 t and 723,607 t
quota 120,000 t: steady states 400,000 t and 600,000 t
quota 125,000 t: steady states 500,000 t and 500,000 t
quota 130,000 t: no steady state
yearly factor at 120,000 t: 0.900 at the upper, 1.100 at the lower
130,000 t: loses 5,000 t in year 1, 5,012 t in year 2; 446,160 t after 10 yr, 353,365 t after 20, zero after 30
catch over 50 yr: 130,000 t quota 3.77 million t, 120,000 t quota 6.00 million t (stock 598,895 t at the end)
At 120,000 t the crossings sit at 400,000 and 600,000 t, with yearly factors 1.100 and 0.900: a gap of 10,000 t grows to 11,000 t at the lower one and shrinks to 9,000 t at the upper. At 125,000 t they meet at the top; above, the line misses the parabola and the stock falls every year. Two steady states that merge and vanish as a knob turns make a saddle-node bifurcation. The 130,000 t run starts at the top, where growth falls short of the quota by only 5,000 t, so the first decade looks harmless; every tonne lost widens the shortfall. Fifty years bring 3.77 million t, against 6.00 for the lower quota.
Show code
cut_23, _ = play("quota", 130_000, switch=(23, 100_000))
cut_24, _ = play("quota", 130_000, switch=(24, 100_000))
fig, (ax, ax2) = plt.subplots(1, 2, figsize=(7.6, 3.6), gridspec_kw=dict(wspace=0.3))
years = np.arange(YEARS + 1)
ax.axhline(steady_states(100_000)[0] / 1e3, color=MUTED, ls="--", lw=1)
ax.plot(years, stock_120 / 1e3, color=ACCENT, alpha=0.4)
ax.plot(years, stock_130 / 1e3, color=ACCENT)
ax.plot(years[23:], cut_23[23:] / 1e3, color=ACCENT, ls=":")
ax.plot(years[24:], cut_24[24:] / 1e3, color=ACCENT, ls=":")
for text, x, y, ha in [("120,000 t", 8, 610, "center"), ("cut after 23 yr", 44, 735, "center"),
                       ("130,000 t", 8, 340, "center"), ("cut after 24 yr", 40, 60, "right")]:
    ax.text(x, y, text, color=ACCENT, ha=ha, va="bottom")
ax.set(xlabel="year", ylabel="stock / 1,000 t", xlim=(0, YEARS), ylim=(0, 800))

draw_diagram(ax2, quotas=[(H, ACCENT) for H in [100_000, 120_000, 125_000, 130_000]], msy_label=None)
ax2.set(ylabel="growth or catch / 1,000 t per yr", ylim=(0, 160))
for H in [100_000, 120_000]:
    low, high = steady_states(H)
    ax2.plot(high / 1e3, H / 1e3, "o", ms=6, color=INK, zorder=4)
    ax2.plot(low / 1e3, H / 1e3, "o", ms=6, mfc="white", mec=INK, zorder=4)
for H, dy in [(130_000, 4.5), (125_000, 0), (120_000, -4.5), (100_000, 0)]:     # quota labels beside the axes, spread apart
    ax2.text(1020, H / 1e3 + dy, f"{H // 1000}", color=ACCENT, va="center", clip_on=False)
ax2.text(1020, 146, "quota", color=ACCENT, va="center", clip_on=False)
for x_from, x_to in [(330, 150), (440, 560), (850, 670)]:      # which way the stock moves under 120,000 t
    ax2.annotate("", (x_to, 12), (x_from, 12), arrowprops=dict(arrowstyle="->", color=ACCENT, lw=1.2))
plt.show()
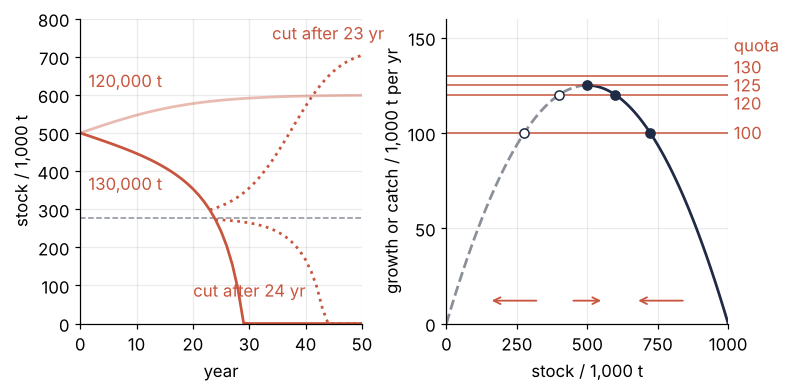
The lower crossing is a point of no return. Cut the quota to 100,000 t after 23 years, with 298,100 t left, above that quota's lower crossing at 276,393 t, and the stock recovers. A year later, at 272,800 t, it dies anyway:
for year in [23, 24]:
    stock, _ = play("quota", 130_000, switch=(year, 100_000))
    print(f"cut to 100,000 t after {year} yr: stock then {stock[year]:,.0f} t "
          f"(lower crossing {steady_states(100_000)[0]:,.0f} t), after 50 yr {stock[-1]:,.0f} t")
cut to 100,000 t after 23 yr: stock then 298,127 t (lower crossing 276,393 t), after 50 yr 703,879 t
cut to 100,000 t after 24 yr: stock then 272,751 t (lower crossing 276,393 t), after 50 yr 0 t
A fixed fleet rides out the bad years
With Good and bad years on, each year's growth rate is multiplied by a weather factor f that averages 1. One year in six f is below 0.62: a bad year. The game holds 20 fifty-year sequences, the notebook 1,000. Press New years once for sequence 2: the 120,000 t quota loses the stock in year 10. Reset, press Boats, and keep the 8 boats, which in calm years land the same 120,000 t from the same 600,000 t stock. The same weather now shakes the stock without losing it.
Show code
weather = FACTORS[1]                                # sequence 2, the first of the game's 20 the quota loses
stock_q, catch_q = play("quota", 120_000, factors=weather)
stock_b, catch_b = play("boats", 8, factors=weather)
fig = plt.figure(figsize=(7, 6))
grid = fig.add_gridspec(3, 2, height_ratios=[1.4, 1.5, 0.6], hspace=0.28, wspace=0.06)
for j, (mode, value, stock) in enumerate([("quota", 120_000, stock_q), ("boats", 8, stock_b)]):
    ax = fig.add_subplot(grid[0, j])
    boats = boats_out(mode, value, stock[9])
    draw_scene(ax, stock[9], boats, label=f"{boats} boats")
    setting = "quota 120,000 t" if mode == "quota" else "8 boats"
    ax.text(0.8, 1.04, f"{setting}, year 9, {stock[9]:,.0f} t", color=MUTED, ha="center", va="top")
ax = fig.add_subplot(grid[1, :])
ax.plot(years, stock_q / 1e3, color=ACCENT)
ax.plot(years, stock_b / 1e3, color=SECOND)
ax.text(11, 40, "quota 120,000 t", color=ACCENT)
ax.text(14, 660, "8 boats", color=SECOND)
ax.set(ylabel="stock / 1,000 t", xlim=(0, YEARS), ylim=(0, 800))
ax.tick_params(labelbottom=False)
ax = fig.add_subplot(grid[2, :], sharex=ax)
bad = weather < 0.62
ax.bar(np.arange(YEARS) + 0.5, weather, width=0.8, color=np.where(bad, INK, MUTED), alpha=0.8)
ax.axhline(1, color=MUTED, lw=1, ls="--")
ax.set(xlabel="year", ylabel="f", ylim=(0, 2.5))
plt.show()
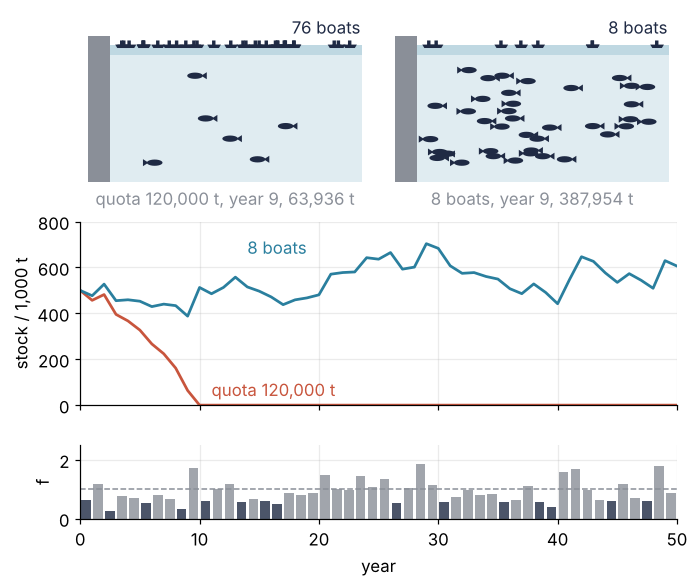
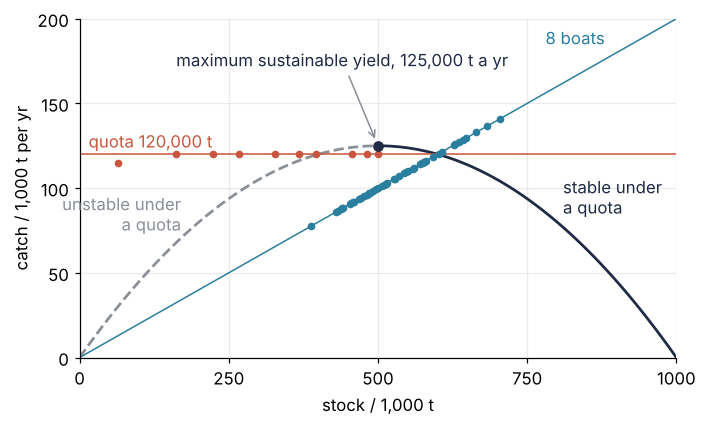
Boats take a share of the stock, not a tonnage: each takes q = 0.025 of it a year, so B boats catch C = qBN, a line through the origin on the picture. It crosses the parabola once, at N* = K(1 − qB/r). Like a quota's upper crossing it is stable, and there is no lower one to fall past. After a bad year the quota still takes 120,000 t of a smaller stock; years 1 to 3 of sequence 2 push it below 400,000 t, the lower crossing, and from there it falls even in calm years.
The cell runs three policies through all 1,000 sequences: the 120,000 t quota, the 8 boats, and a quota at the MSY, the largest with a steady state. It also computes the fleet's yearly factor, to set beside the quota's 0.900. play steps all 1,000 rows of FACTORS at once.
quota_N, quota_C = play("quota", 120_000, factors=FACTORS)
boats_N, boats_C = play("boats", 8, factors=FACTORS)
msy_N, _ = play("quota", MSY, factors=FACTORS)
print(f"stock lost within 50 yr: quota 120,000 t {np.mean(quota_N[:, -1] == 0):.1%}, 8 boats "
      f"{np.mean(boats_N[:, -1] == 0):.1%}, quota at the MSY {np.mean(msy_N[:, -1] == 0):.1%}")
print(f"8 boats in sequence 2: stock between {stock_b.min():,.0f} t and {stock_b.max():,.0f} t")
print(f"lowest stock with 8 boats in any sequence: {boats_N.min():,.0f} t")
print(f"mean catch over 50 yr: quota {quota_C.sum(axis=1).mean() / 1e6:.2f} million t, "
      f"8 boats {boats_C.sum(axis=1).mean() / 1e6:.2f} million t")
N_star = K * (1 - Q * 8 / R)
print(f"8 boats: steady state {N_star:,.0f} t, catch {Q * 8 * N_star:,.0f} t per yr, "
      f"yearly factor {yearly_factor(N_star, 'boats', 8):.3f}")
stock lost within 50 yr: quota 120,000 t 43.7%, 8 boats 0.0%, quota at the MSY 69.0%
8 boats in sequence 2: stock between 387,954 t and 703,739 t
lowest stock with 8 boats in any sequence: 363,789 t
mean catch over 50 yr: quota 4.77 million t, 8 boats 5.86 million t
8 boats: steady state 600,000 t, catch 120,000 t per yr, yearly factor 0.700
The quota loses the stock in 43.7 % of the sequences, the boats in none: they keep it between 388,000 and 704,000 t in sequence 2 and above 364,000 t in all. Their yearly factor is 0.700 against the quota's 0.900, so the gap a bad year leaves closes faster.
A quota at exactly the MSY does worse: a stock pushed below 500,000 t keeps falling, and the first bad year pushes it there. It loses the stock in 69.0 % of the sequences.
Every point of the parabola is steady under the quota at its height, stable on the right, unstable on the left. Steady states against a knob form a bifurcation diagram, here with the axes swapped.
Show code
fig, ax = plt.subplots(figsize=(7, 4))
draw_diagram(ax, runs=[(stock_q, catch_q[:10], ACCENT, 1), (stock_b, catch_b, SECOND, 1)],
             quotas=[(120_000, ACCENT)], fleets=[(8, SECOND)], msy_label=None)
ax.annotate("maximum sustainable yield, 125,000 t a yr", (K / 2e3, MSY / 1e3), xytext=(440, 172), ha="center",
            color=INK, arrowprops=dict(arrowstyle="->", color=MUTED, lw=1, shrinkB=5))
ax.text(810, 85, "stable under\na quota", color=INK)
ax.text(170, 75, "unstable under\na quota", color=MUTED, ha="right")
ax.text(15, 124, "quota 120,000 t", color=ACCENT)
ax.text(880, 185, "8 boats", color=SECOND, ha="right")
plt.show()
How the game computes it
The state. One object holds everything that changes, in tonnes and years. history holds one entry per year (the stock at its start, the catch, the policy, the factor f), previous the last run, clock the time into the current year, and swim the time the fish have been swimming:
const state = {year: 0, stock: DATA.stock0, mode: "quota", quota: 120000, boats: 8, weather: false, set: 1,
  total: 0, running: false, history: [], previous: [], clock: 0, swim: 0};
One year. requestAnimationFrame asks the browser to call frame before it next redraws the page, which it does about 60 times a second. Each call adds the elapsed time to state.clock, never more than 50 ms at once: a game left in a hidden tab resumes where it stopped instead of skipping decades. When the clock passes 0.8 s, frame runs year(), the rule of the first section, growth first and catch second. In JavaScript cond ? x : y means x if cond else y:
function year() {
  const N = state.stock;
  const f = state.weather ? DATA.factors[state.set - 1][state.year] : 1;
  const grown = N + R * f * N * (1 - N / K);
  const C = state.mode === "quota" ? Math.min(state.quota, grown) : Q * state.boats * N;
  let next = Math.max(grown - C, 0);
  if (next < 1) next = 0;                               // less than a tonne left: collapsed
  state.history.push({stock: N, catch: C, mode: state.mode, f});
  state.total += C;
  state.stock = next;
  state.year += 1;
  if (state.year >= YEARS || next === 0) Object.assign(state, {running: false, clock: 0});
}
In quota mode the boats are a display. The quota is always met as long as there are fish; the scene shows the boats it would take, the quota divided by what one boat lands. (s) => ... is a small function of s, Python's lambda s: ...:
const boatsOut = (s) => s.mode === "boats" ? s.boats : s.stock > 0 ? Math.ceil(s.quota / (Q * s.stock)) : 0;
The scene. The sea holds one fish per 10,000 t. Each fish has a start, a speed, and a phase from a small seeded generator, so the fish start in the same places on every load; its position follows from swim alone and turns back at the sea's edges. When the stock falls the fish at the end of the list go, and none of the others jumps. The boats sail out in the first fifth of each year and back in the last; at most 30 are drawn, and a number at the quay counts the rest.
From the notebook into the game. The notebook writes r, K, q, the start, the 20 weather sequences of 50 factors each with three decimals, and the parabola at 201 stocks into the game file as JSON, the text format for numbers and lists that JavaScript reads directly. It sits in a <script type="application/json" id="data"> element, and the script parses it once; nothing is fetched, so the file runs from disk. The curve under the sea is the notebook's, and the game adds the dots.
The diagram. m holds the margins around the plot in pixels, left, right, top, and bottom, and w and h are the width and height left inside them. X turns a stock into a distance from the left edge, Y a catch into a distance from the top:
const m = {l: 40, r: 20, t: 28, b: 36}, w = W - m.l - m.r, h = H - m.t - m.b;
const X = (N) => m.l + (N / K) * w, Y = (C) => m.t + h - (C / 200000) * h;   // stock along, catch up
The cell that writes the game. The factors were rounded to three decimals in the setup cell and sort_keys=True fixes the order of the keys, so the JSON is identical on every run. Every </ in it becomes <\/, because a browser closes a script element at the first </script it meets, even in the middle of data. A hidden cell below holds the HTML shell around the game as a template string, colored for light and dark mode.
Show code
# The page around the game: the site's light and dark colors, the two canvases, the readouts, and the
# controls. game.js fills in every number; the notebook fills in DATA and SCRIPT.
TEMPLATE = """<!doctype html>
<html lang="en">
<head>
<meta charset="utf-8">
<meta name="viewport" content="width=device-width, initial-scale=1">
<title>Run a fishery for fifty years</title>
<style>
:root { --bg: #ffffff; --fg: #1f2a44; --ink: #1f2a44; --accent: #c8553d; --second: #2a7f9e; --muted: #8a8f98; }
@media (prefers-color-scheme: dark) {
  :root { --bg: #141a2a; --fg: #e9ecf3; --ink: #c9d0e3; --accent: #e3826b; --second: #6ec1de; --muted: #8e97ab; }
}
* { box-sizing: border-box; }
html, body { margin: 0; height: 100%; overflow: hidden; background: var(--bg); color: var(--fg);
  font: 15px/1.3 system-ui, sans-serif; -webkit-text-size-adjust: 100%; }
body { display: grid; gap: 4px; padding: 4px 6px 6px; grid-template-columns: minmax(0, 1fr);
  grid-template-rows: minmax(0, 1fr) auto minmax(0, 0.7fr) auto; grid-template-areas: "sea" "readouts" "chart" "controls"; }
.view { position: relative; min-height: 0; } .view canvas { position: absolute; inset: 0; width: 100%; height: 100%; }
#sea-view { grid-area: sea; } #chart-view { grid-area: chart; }
#readouts { grid-area: readouts; display: flex; flex-wrap: wrap; justify-content: space-between; gap: 0 8px;
  font-size: 14px; font-variant-numeric: tabular-nums; } #readouts span { white-space: nowrap; }
#catch, #total { color: var(--accent); }
#controls { grid-area: controls; display: grid; gap: 4px; align-content: end; }
.row { display: flex; align-items: center; gap: 6px; }
.row label { min-width: 3.2em; } #knob { flex: 1 1 0; min-width: 0; width: 0; margin: 0; accent-color: var(--second); }
#knob-val { min-width: 6.2em; text-align: right; font-variant-numeric: tabular-nums; }
button { font: inherit; color: var(--second); background: none; border: 1.5px solid var(--second); border-radius: 4px;
  padding: 0.2em 0.7em; }
button[aria-pressed="true"], #play { color: var(--bg); background: var(--second); }
.seg { display: flex; } .seg button + button { margin-left: -1.5px; }
button.step { padding: 0; width: 1.9em; }
#weather { margin-left: auto; }
button, input { touch-action: manipulation; }
@media (pointer: coarse) { button { min-height: 44px; min-width: 44px; } input[type=range] { height: 44px; } }
@media (min-width: 600px) {
  body { grid-template-columns: minmax(0, 3fr) minmax(0, 2fr); grid-template-rows: auto minmax(0, 1fr) auto;
    grid-template-areas: "sea readouts" "sea chart" "sea controls"; gap: 8px 14px; padding: 10px;
    font-size: clamp(14px, 1.5vw, 18px); }
  #readouts { display: grid; grid-template-columns: repeat(2, auto); font-size: 1.1em; }
}
@media (min-width: 600px) and (max-height: 420px) {
  body { grid-template-rows: auto minmax(0, 1fr); grid-template-areas: "sea readouts" "sea controls"; }
  #chart-view, #growth { display: none; }
}
</style>
</head>
<body>
<div class="view" id="sea-view"><canvas id="sea"></canvas></div>
<div id="readouts"><span id="year"></span><span id="stock"></span><span id="catch"></span>
  <span id="total"></span><span id="boats"></span><span id="growth"></span></div>
<div class="view" id="chart-view"><canvas id="chart"></canvas></div>
<div id="controls">
  <div class="row"><div class="seg" role="group" aria-label="Policy"><button id="quota-mode">Quota</button><button id="boats-mode">Boats</button></div>
    <button id="weather" aria-pressed="false">Good and bad years</button></div>
  <div class="row"><label for="knob" id="knob-label">Quota</label><button class="step" id="minus" aria-label="Less">−</button>
    <input id="knob" type="range" min="0"><button class="step" id="plus" aria-label="More">+</button><span id="knob-val"></span></div>
  <div class="row"><button id="play">Play</button><button id="reset">Reset</button><button id="next">New years</button></div>
</div>
<script type="application/json" id="data">{{DATA}}</script>
<script>{{SCRIPT}}</script>
</body>
</html>
"""
N_curve = np.linspace(0, K, 201)
game_data = {
    "r": R, "K": K, "q": Q, "stock0": N0, "years": YEARS, "year_s": YEAR_S, "fish_t": FISH_T, "msy": MSY,
    "factors": FACTORS[:20].tolist(),               # already rounded to 3 decimals
    "curve": [[int(N), int(round(R * N * (1 - N / K)))] for N in N_curve],
}
# sorted keys and fixed rounding: two runs write the same bytes; "<\/" keeps "</" out of the script element
data = json.dumps(game_data, sort_keys=True, separators=(",", ":")).replace("</", "<\\/")
script = Path("minigame/fishery/game.js").read_text(encoding="utf-8")
html = TEMPLATE.replace("{{DATA}}", data).replace("{{SCRIPT}}", script)
Path("assets").mkdir(exist_ok=True)
Path("assets/fishery.html").write_text(html, encoding="utf-8", newline="\n")
size = Path("assets/fishery.html").stat().st_size
print(f"assets/fishery.html: {len(game_data['factors'])} weather sequences, {len(game_data['curve'])} curve points, {size / 1024:.0f} kB")
assets/fishery.html: 20 weather sequences, 201 curve points, 26 kB
Variations
- A fleet with a ceiling. In
year(), cap the quota's catch atQ * 15 * N, what 15 boats can land. The 130,000 t quota then turns into a fixed fleet as the stock falls, and the stock settles at 250,000 t with 93,750 t a year instead of dying. - A quota that follows the stock. Keep the quota at 120,000 t while the stock is above 500,000 t and cut it in proportion below,
Math.min(1, N / 500000) * state.quota, the shape of the harvest control rules fisheries agencies use. Over the 1,000 sequences it loses no stock, and it catches 5.83 million t on average, against 4.77 for the fixed quota. - A faster fish. Set
rto 2.2 in the data and the quota to 0. The unfished stock no longer settles: it jumps between 746,000 and 1,163,000 t every other year, a two-year cycle and the first step of period doubling.
Further reading
- C. W. Clark, Mathematical Bioeconomics, 3rd ed. (Wiley, 2010), for harvesting a logistic stock under a quota and under a fixed effort.
- S. H. Strogatz, Nonlinear Dynamics and Chaos, 2nd ed. (Westview, 2015), chapter 3, for the saddle-node bifurcation, with a harvesting exercise, and the continuous-time version of this model.
- M. B. Schaefer, "Some aspects of the dynamics of populations important to the management of the commercial marine fisheries", Bull. Inter-Am. Trop. Tuna Comm. 1, 27 (1954), the surplus production model.
- P. A. Larkin, "An epitaph for the concept of maximum sustained yield", Trans. Am. Fish. Soc. 106, 1 (1977).
- MDN on the Canvas API, whose calls draw everything
game.jsshows. - Related tutorials on this site: Draw a phase portrait of a two-variable ODE system for steady states and their stability in two variables, PySINDy from the ground up: predator-prey equations from data for populations that interact, and Genetic drift: why a neutral allele is fixed or lost, and how long it takes for chance in a population.
- Download the notebook. It was executed with the library versions in the header.
- Download the game, one HTML file of 26 kB that runs offline in any browser.