Neutron moderation: why hydrogen needs 18 collisions and carbon 115
Afterwards you can explain why light nuclei slow neutrons fastest, compute the collisions to thermal energy for any moderator, and check it by Monte Carlo.
- Field
- Engineering, Physics
- Libraries
matplotlib 3.11.2numpy 2.4.3
py-neutron-moderation.ipynb, executed with the versions above. The download needs a free account
Run it yourself. In a terminal, this installs exactly the versions above:
pip install numpy==2.4.3 matplotlib==3.11.2 jupyterlabThe question
A neutron born in a uranium fission flies off with about 2 MeV of kinetic energy (one electronvolt, 1.6 × 10⁻¹⁹ J, is what an electron gains across 1 V). In a thermal reactor, one that runs on slow neutrons, it is most likely to cause the next fission once it is down to about 0.025 eV, the energy of thermal motion at room temperature: a factor of 8 × 10⁷ lower. Getting it there is neutron moderation, and the material that does it, the moderator, has nothing but elastic collisions to work with. Here are 16 neutrons slowing down, eight in hydrogen and eight in carbon:
Show code
import numpy as np
import matplotlib.pyplot as plt

plt.rcParams.update({
    "figure.figsize": (7, 3.6), "figure.dpi": 110,
    "axes.spines.top": False, "axes.spines.right": False,
    "axes.grid": True, "grid.alpha": 0.25,
    "font.size": 11, "lines.linewidth": 1.8,
})
INK, ACCENT, SECOND, MUTED = "#1f2a44", "#c8553d", "#2a7f9e", "#8a8f98"

E0, E_TH = 2e6, 0.025                     # eV: fission neutron, thermal neutron at room temperature
L = np.log(E0 / E_TH)                     # how far down the neutron has to go, on a log scale
MODERATORS = {"hydrogen": 1, "deuterium": 2, "carbon": 12}
COLOR = {"hydrogen": SECOND, "deuterium": INK, "carbon": ACCENT}


def alpha(A):
    """Smallest fraction of its energy a neutron keeps in one collision with mass number A."""
    return ((A - 1) / (A + 1)) ** 2


def xi(A):
    """Mean lethargy gain per collision, ln(E/E') averaged over one collision."""
    a = alpha(A)
    return 1.0 if A == 1 else 1 + a * np.log(a) / (1 - a)


# The histories below are simulated by the method this tutorial explains, so that the
# answer can be checked at the end. Pretend you have not seen this cell.
rng = np.random.default_rng(2026)


def history(A):
    """Energies of one neutron from E0 down past E_TH, one entry per collision."""
    E = [E0]
    while E[-1] > E_TH:
        E.append(E[-1] * (1 - (1 - alpha(A)) * rng.random()))   # kept fraction uniform on (alpha, 1]
    return np.array(E)


shown = {"hydrogen": [], "carbon": []}                       # kept for the teaser at the end
fig, ax = plt.subplots(figsize=(8, 3.5))
for name in ["hydrogen", "carbon"]:
    n_needed = []
    for k in range(8):
        E = history(MODERATORS[name])
        shown[name].append(E)
        n_needed.append(E.size - 1)
        ax.step(np.arange(E.size), E, where="post", color=COLOR[name], lw=1.2, alpha=0.6)
    print(f"{name:8s} collisions to 0.025 eV: {' '.join(f'{n:3d}' for n in sorted(n_needed))}")
ax.text(27, 3, "hydrogen", color=SECOND, ha="left", va="center")
ax.text(66, 3e4, "carbon", color=ACCENT, ha="left", va="center")
ax.axhspan(0.5, 1e5, color=MUTED, alpha=0.08, lw=0)          # the epithermal range
ax.axhline(E_TH, color=MUTED, lw=1, ls="--")
ax.text(30, E_TH * 1.6, "thermal, 0.025 eV", color=MUTED, ha="left", va="bottom")
for E_mid, text in [(1e6, "fast"), (2e2, "epithermal")]:
    ax.text(139, E_mid, text, color=MUTED, ha="right", va="center")
ax.set(yscale="log", xlim=(0, 140), ylim=(0.01, 1e7), xlabel="collision number", ylabel="energy / eV")
plt.show()
hydrogen collisions to 0.025 eV:  13  16  17  20  23  24  24  26
carbon   collisions to 0.025 eV:  98 103 103 112 112 114 115 124
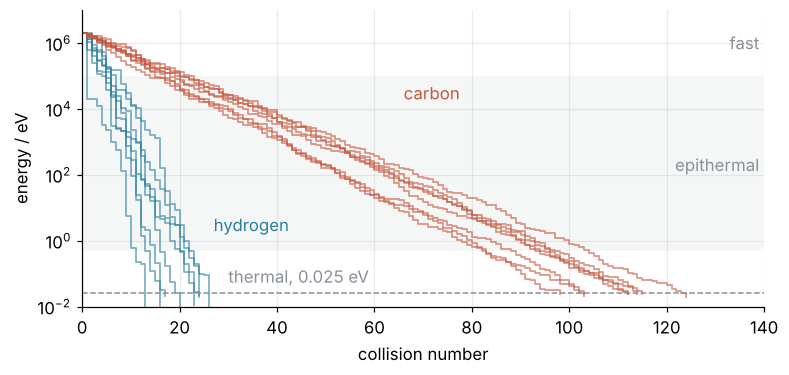
Each staircase is one neutron, each step one collision. The figure also carries the names of the energy ranges. The dashed line marks the thermal range, where the neutron is in equilibrium with the moderator's atoms. The top of the axis, from 100 keV up to 10 MeV, is the fast range, where fission neutrons are born. Everything in between, roughly 0.5 eV to 100 keV, is the epithermal range, where the neutron is still slowing down.
Two things are obvious. Hydrogen gets its neutrons to the thermal line in 13 to 26 collisions, carbon in 98 to 124. And both sets of staircases come down as straight lines on the logarithmic axis, with some jitter, whether the neutron carries a megaelectronvolt or a hundredth of an electronvolt.
Less obvious: carbon is twelve times heavier than hydrogen and needs six times as many collisions, not twelve times, and not 144. What sets the count, and why do the steps keep the same average size on a log scale all the way down? The answer decides what a reactor is built from: water, heavy water, or graphite.
The idea: a collision keeps a fixed range of fractions
Take one collision of a neutron with a nucleus of mass number A, free and at rest. Two cases set the limits. In a head-on collision the neutron bounces straight back and keeps the fraction
of its energy. Against a proton, A = 1, that is zero: like a billiard ball hitting another dead center, the neutron stops. Against carbon α = 0.716, so the neutron keeps 72 % even in its worst collision. A glancing collision keeps nearly everything. Every collision lands somewhere between αE and E.
Where in between follows from the center-of-mass frame, which moves at 1/(A + 1) of the neutron's speed. There an elastic collision only turns the neutron's velocity, whose length stays A/(A + 1) of the incoming speed. In the lab the outgoing velocity is the center-of-mass velocity plus this vector of fixed length, so its tip lies on a sphere. Here is its cross section for three nuclei:
Show code
cos_c = np.linspace(-1, 1, 11)                       # equally spaced cosines of the center-of-mass angle
fig, axes = plt.subplots(1, 6, figsize=(8, 3.1),
                         gridspec_kw={"width_ratios": [3, 0.55] * 3, "wspace": 0.25})
for (name, A), ax, bar in zip(MODERATORS.items(), axes[::2], axes[1::2]):
    c = COLOR[name]
    V = 1 / (A + 1)                                   # center-of-mass velocity, incoming speed = 1
    r = A / (A + 1)                                   # neutron speed in the center-of-mass frame
    phi = np.linspace(0, 2 * np.pi, 300)
    tip_x, tip_y = V + r * cos_c, r * np.sqrt(1 - cos_c**2)   # tips of the outgoing velocity
    ax.plot(V + r * np.cos(phi), r * np.sin(phi), color=c, lw=1.2)
    for x, y in zip(tip_x, tip_y):                    # the same vector of length r, turned
        ax.plot([V, x], [0, y], color=MUTED, lw=0.8, alpha=0.6)
    ax.annotate("", xy=(1, 0), xytext=(0, 0),
                arrowprops=dict(arrowstyle="-|>", color=MUTED, lw=1.4, shrinkA=0, shrinkB=0))
    ax.plot(V, 0, "o", color=MUTED, ms=6, zorder=3)
    ax.plot(tip_x, tip_y, "o", color=c, ms=6, zorder=3)
    ax.set(xlim=(-0.9, 1.05), ylim=(-0.95, 0.98), aspect="equal")
    ax.set_axis_off()
    ax.text(0.5, -0.02, f"A = {A}, {name}\nkeeps {100 * alpha(A):.0f} to 100 %", color=c,
            transform=ax.transAxes, ha="center", va="top")
    kept = (A**2 + 2 * A * cos_c + 1) / (A + 1) ** 2  # E'/E for each tip
    bar.plot([0, 0], [alpha(A), 1], color=c, lw=7, alpha=0.3, solid_capstyle="butt")
    bar.plot(np.zeros_like(kept), kept, "_", color=c, ms=14, mew=1.6)
    bar.set(xlim=(-1, 1), ylim=(-0.02, 1.02), xticks=[], yticks=[0, 0.5, 1])
    bar.yaxis.tick_right()
    bar.spines[["left", "bottom"]].set_visible(False)
    bar.spines["right"].set_visible(True)
    bar.grid(False)
for bar in axes[1:-1:2]:
    bar.tick_params(labelright=False)
axes[-1].set_ylabel("E′/E")
axes[-1].yaxis.set_label_position("right")
plt.show()
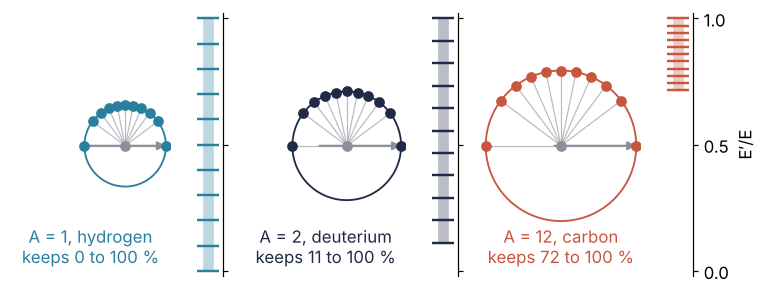
The arrow is the incoming velocity, the gray dot the center-of-mass velocity, the circle the possible outgoing velocities. Hydrogen's circle passes through zero, where a head-on hit leaves the neutron at rest. Carbon's is nearly centered on zero, so the neutron always leaves with most of its speed. The outgoing energy grows linearly with cos θ_c, the cosine of the center-of-mass scattering angle (derived in Formalization below).
Isotropic scattering means every direction on the sphere is equally likely, which is not the same as every angle θ_c. A band around the equator has more area than a band of the same angular width near a pole, and Archimedes showed that a band's area depends only on its height, its spread in cos θ_c. So cos θ_c is uniform on [−1, 1], and because the energy is linear in it, the energy after the collision is uniform on [αE, E]. The 11 dots sit at equally spaced cos θ_c: they bunch toward the ends of the circle, and their energies, ticked on the bar, come out evenly spaced. A uniform angle on a circle, the picture a flat sketch suggests, would pile the energies up at αE and E instead.
Isotropy holds because below a few MeV the neutron's wavelength is large compared with a light nucleus, so only s-wave scattering contributes, a quantum result to take on trust, with no preferred direction in the center-of-mass frame. It fails for heavier nuclei near the top of the range, where scattering turns forward. The free nucleus at rest is wrong near 0.025 eV, where a real neutron ends in a thermal distribution rather than at a sharp line.
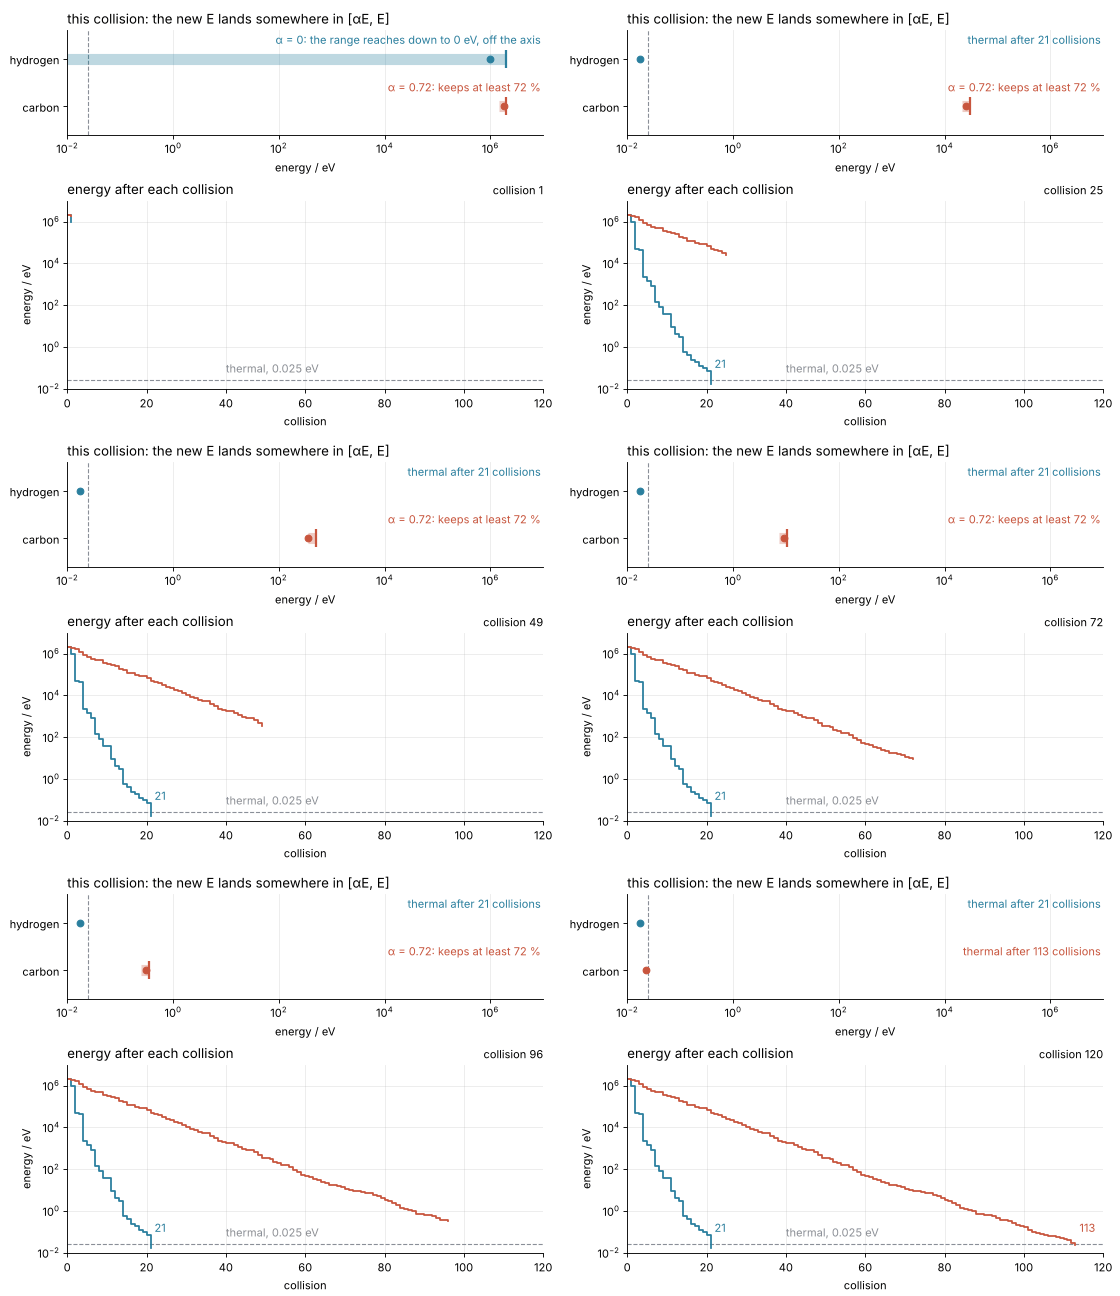
So one collision is one random number: multiply the energy by a fraction drawn uniformly between α and 1. Here is one hydrogen and one carbon neutron doing that, one frame per collision:
Show code
"""Slowing down: one hydrogen neutron and one carbon neutron from 2 MeV to 0.025 eV.

Top: for the collision being made, the range [alpha E, E] the new energy can land in, on a
log energy axis, and the energy drawn from it. Bottom: energy against collision number,
traced so far. One frame per collision.

Renders ../../assets/slowing-down.gif. Matplotlib version for the draft; the Visual
Designer refines it. Run from this directory:

    python scene.py
"""
from pathlib import Path

import matplotlib
import numpy as np

matplotlib.use("Agg")
import matplotlib.pyplot as plt
from matplotlib.animation import FuncAnimation, PillowWriter

OUT = Path(__file__).resolve().parents[2] / "assets" / "slowing-down.gif"
INK, ACCENT, SECOND, MUTED = "#1f2a44", "#c8553d", "#2a7f9e", "#8a8f98"

# Same physics as index.md: kept fraction uniform on [alpha, 1].
E0, E_TH = 2e6, 0.025
NEUTRONS = {"hydrogen": (1, SECOND, 1.0), "carbon": (12, ACCENT, 0.0)}   # A, color, row in the top panel
N_FRAMES = 120
rng = np.random.default_rng(1)


def alpha(A):
    return ((A - 1) / (A + 1)) ** 2


def history(A):
    E = [E0]
    while E[-1] > E_TH:
        E.append(E[-1] * (1 - (1 - alpha(A)) * rng.random()))
    return np.array(E)


paths = {name: history(A) for name, (A, _, _) in NEUTRONS.items()}
assert paths["carbon"].size - 1 < N_FRAMES - 6, "carbon must arrive before the last frames"

plt.rcParams.update({"font.size": 10, "axes.spines.top": False, "axes.spines.right": False,
                     "axes.grid": True, "grid.alpha": 0.25})
fig, (ax_top, ax_bot) = plt.subplots(2, 1, figsize=(7, 5.4), dpi=80,
                                     gridspec_kw={"height_ratios": [1, 1.8], "hspace": 0.45})
fig.subplots_adjust(left=0.12, right=0.97, top=0.93, bottom=0.1)

ax_top.set(xscale="log", xlim=(1e-2, 1e7), ylim=(-0.6, 1.6), yticks=[0, 1],
           yticklabels=["carbon", "hydrogen"], xlabel="energy / eV")
ax_top.set_title("this collision: the new E lands somewhere in [αE, E]", loc="left")
ax_top.axvline(E_TH, color=MUTED, lw=1, ls="--")
ax_top.grid(axis="y", visible=False)

ax_bot.set(yscale="log", xlim=(0, N_FRAMES), ylim=(1e-2, 1e7),
           xlabel="collision", ylabel="energy / eV")
ax_bot.set_title("energy after each collision", loc="left")
ax_bot.axhline(E_TH, color=MUTED, lw=1, ls="--")
ax_bot.text(40, E_TH * 1.8, "thermal, 0.025 eV", color=MUTED, ha="left", va="bottom")

artists = {}
for name, (A, color, row) in NEUTRONS.items():
    (bar,) = ax_top.plot([], [], color=color, lw=10, alpha=0.3, solid_capstyle="butt")
    (dot,) = ax_top.plot([], [], "o", color=color, ms=6, zorder=3)
    (start,) = ax_top.plot([], [], "|", color=color, ms=16, mew=2)
    note = ax_top.text(9e6, row + 0.4, "", color=color, ha="right", va="center")
    (stairs,) = ax_bot.step([], [], where="post", color=color, lw=1.6)
    label = ax_bot.text(0, 0, "", color=color, va="bottom")
    artists[name] = (bar, dot, start, note, stairs, label)
counter = ax_bot.text(1.0, 1.02, "", transform=ax_bot.transAxes, ha="right", va="bottom")


def update(k):
    """Frame k shows collision k: from E[k-1] to E[k]."""
    k = max(k, 1)
    for name, (A, color, row) in NEUTRONS.items():
        E = paths[name]
        bar, dot, start, note, stairs, label = artists[name]
        n_done = E.size - 1                                   # collisions this neutron needs
        j = min(k, n_done)
        stairs.set_data(np.arange(j + 1), E[: j + 1])
        if k <= n_done:
            lo = max(alpha(A) * E[k - 1], 1e-3)               # alpha = 0: the range runs off the axis
            bar.set_data([lo, E[k - 1]], [row, row])
            start.set_data([E[k - 1]], [row])
            dot.set_data([E[k]], [row])
            note.set_text("α = 0: the range reaches down to 0 eV, off the axis" if A == 1
                          else f"α = {alpha(A):.2f}: keeps at least {100 * alpha(A):.0f} %")
            label.set_text("")
        else:
            bar.set_data([], [])
            start.set_data([], [])
            dot.set_data([E[-1]], [row])
            note.set_text(f"thermal after {n_done} collisions")
            label.set_position((n_done + 1, E_TH * 3))
            label.set_text(f"{n_done}")
    counter.set_text(f"collision {k}")
    return ()


anim = FuncAnimation(fig, update, frames=range(1, N_FRAMES + 1), blit=False)
anim.save(OUT, writer=PillowWriter(fps=12))
print("wrote", OUT, OUT.stat().st_size // 1024, "kB;",
      {name: E.size - 1 for name, E in paths.items()}, "collisions")
Hydrogen's range has no lower end, since α = 0, so its bar runs off the axis. Carbon's short bar keeps its length on the log axis as the neutron slows. Hydrogen arrives after 21 collisions, carbon after 113, both in steps of about the same size from start to finish.
Why the logarithm: every collision is the same step on a log scale
On a linear axis the energy lost per collision shrinks as the neutron slows. The first collision in hydrogen takes away 1 MeV on average, the last ones a few hundredths of an electronvolt, so an average energy loss per collision means nothing. What does not change is the fraction kept, uniform between α and 1 at 2 MeV and at 1 eV alike. A fixed fraction is a fixed distance on a log scale, so ln E falls by the same amount on average in every collision.
Reactor physicists call u = ln(E₀/E) the lethargy: how far, on a log scale, the neutron has come down from its birth energy E₀. It starts at 0 and has to reach ln(2 MeV / 0.025 eV) = 18.2. The average lethargy gain per collision is written ξ, the Greek letter xi, and it depends only on the nucleus. Here are the gains of 10⁵ collisions in each moderator, with ξ dashed:
Show code
rng_demo = np.random.default_rng(1)                  # its own stream, so the main one stays as it is
fig, ax = plt.subplots(figsize=(7, 3.4))
bins = np.linspace(0, 4, 161)
for name, A in MODERATORS.items():
    gain = -np.log(1 - (1 - alpha(A)) * rng_demo.random(100_000))
    ax.hist(gain, bins=bins, density=True, histtype="step", color=COLOR[name], lw=1.6)
    y_label = {"hydrogen": 2.2, "deuterium": 1.7, "carbon": 3.6}[name]
    ax.vlines(xi(A), 0, y_label, color=COLOR[name], lw=1, ls="--")      # dashed up to its label
    ax.text(xi(A) + 0.04, y_label, f"{name}, mean {xi(A):.3f}", color=COLOR[name], va="center")
    print(f"{name:9s}  mean gain {gain.mean():.3f}   xi {xi(A):.3f}")
ax.set(xlim=(0, 4), ylim=(0, 3.8), xlabel="lethargy gain in one collision, ln(E/E′)", ylabel="probability density")
plt.show()
hydrogen   mean gain 0.999   xi 1.000
deuterium  mean gain 0.724   xi 0.725
carbon     mean gain 0.157   xi 0.158
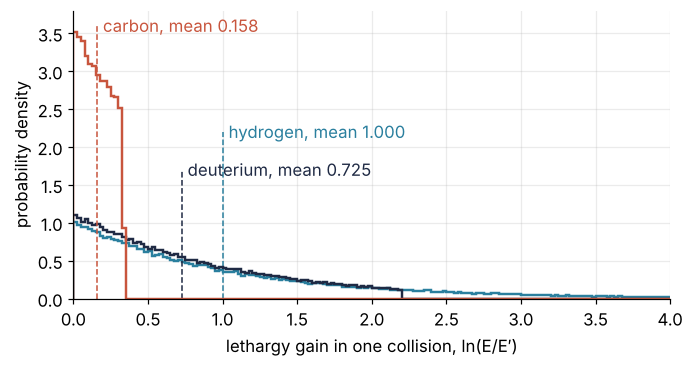
Hydrogen's gains spread from almost nothing to well past 4, where the plot cuts the tail, and average 1.000. Deuterium's stop at 2.20 and average 0.725. Carbon's are a narrow block up to about 0.33 with a mean of 0.158. The draws themselves average 0.999, 0.724, and 0.157.
The number of collisions is then the lethargy the neutron needs divided by what it gains per collision: 18.2/1 = 18.2 for hydrogen, 18.2/0.158 = 115 for carbon. Carbon is twelve times heavier, but its mean step is only 6.3 times shorter than hydrogen's, and that ratio is the six of the question. The name lethargy is apt: the larger it gets, the slower and lazier the neutron.
Formalization
Momentum and energy conservation give the energy after one collision as a function of the center-of-mass scattering angle,
linear in cos θ_c, from α at θ_c = 180° to 1 at θ_c = 0°. With cos θ_c uniform on [−1, 1], E′/E is uniform on [α, 1]. The mean lethargy gain is the average of ln(E/E′) over that interval,
which is 1 for hydrogen, where α ln α goes to zero. For A above about 10, ξ ≈ 2/(A + 2/3) to better than 0.2 %: 0.1579 against 0.1578 for carbon. The gains of successive collisions are independent, so after n collisions the mean lethargy is exactly nξ, and the number of collisions from E₀ down to E is about
A compound mixes nuclei. A collision hits a nucleus of kind i with a probability proportional to \(n_i \sigma_i\), its number per molecule times its scattering cross section, the effective target area it presents to the neutron, measured in barns (1 b = 10⁻²⁴ cm²). The compound's ξ is the weighted average
Cross sections depend on energy, but from about 1 eV to 10 keV, most of the epithermal range, they are nearly flat. The NIST table of neutron scattering lengths lists them for a nucleus bound in a molecule or a crystal. An epithermal neutron hits hard enough that the nucleus recoils as if it were free, which scales each value by (A/(A+1))², the square of the reduced mass in units of the neutron mass. That gives 20.5 b for hydrogen, 3.40 b for deuterium, 4.73 b for carbon, and 3.75 b for oxygen, and water comes out at 0.926, almost hydrogen's 1, because two hydrogens at 20.5 b each dwarf one oxygen at 3.75 b.
Show code
NUCLIDES = {"H-1": 1, "H-2 (D)": 2, "Be-9": 9, "C-12": 12, "O-16": 16, "U-238": 238}
print("nucleus      α       ξ    collisions ln(E0/E_th)/ξ")
for name, A in NUCLIDES.items():
    print(f"{name:9s}  {alpha(A):5.3f}  {xi(A):6.4f}  {L / xi(A):8.1f}")

# Bound-atom scattering cross sections in barns, from the NIST table of neutron scattering lengths
SIGMA_BOUND = {"H": 82.02, "D": 7.64, "C": 5.551, "O": 4.232}
MASS = {"H": 1, "D": 2, "C": 12, "O": 16}
# an epithermal neutron sees a free nucleus: scale by (A/(A+1))²
SIGMA_S = {el: s * (MASS[el] / (MASS[el] + 1)) ** 2 for el, s in SIGMA_BOUND.items()}
print("\nfree-atom σ / b   " + "   ".join(f"{el} {s:.2f}" for el, s in SIGMA_S.items()))
COMPOUNDS = {"water H2O": {"H": 2, "O": 1}, "heavy water D2O": {"D": 2, "O": 1},
             "polyethylene CH2": {"C": 1, "H": 2}}
print()
for name, atoms in COMPOUNDS.items():
    w = {el: n * SIGMA_S[el] for el, n in atoms.items()}          # chance of hitting each kind of nucleus
    xi_mix = sum(w[el] * xi(MASS[el]) for el in w) / sum(w.values())
    print(f"{name:17s}  ξ {xi_mix:5.3f}  {L / xi_mix:6.1f} collisions")


def gain_sd(A):
    """Standard deviation of one lethargy gain, from <g²> over the kept fraction uniform on [α, 1]."""
    a = alpha(A)
    antideriv = 0.0 if A == 1 else a * np.log(a) ** 2 - 2 * a * np.log(a) + 2 * a
    g2 = (2 - antideriv) / (1 - a)                   # integral of ln²x from α to 1, over 1 − α
    return np.sqrt(g2 - xi(A) ** 2)


print()
print("moderator   σ of one gain   predicted sd of the count (σ/ξ)√(L/ξ)   naive √(L/ξ)")
for name, A in MODERATORS.items():
    n = L / xi(A)
    print(f"{name:9s}   {gain_sd(A):6.3f}         {gain_sd(A) / xi(A) * np.sqrt(n):6.2f}"
          f"                              {np.sqrt(n):6.2f}")
print(f"\nstart at 10 MeV instead of 2: + {np.log(5) / xi(1):.1f} collisions in hydrogen, "
      f"+ {np.log(5) / xi(12):.1f} in carbon")
nucleus      α       ξ    collisions ln(E0/E_th)/ξ
H-1        0.000  1.0000      18.2
H-2 (D)    0.111  0.7253      25.1
Be-9       0.640  0.2066      88.1
C-12       0.716  0.1578     115.3
O-16       0.779  0.1199     151.7
U-238      0.983  0.0084    2171.6

free-atom σ / b   H 20.50   D 3.40   C 4.73   O 3.75

water H2O          ξ 0.926    19.6 collisions
heavy water D2O    ξ 0.510    35.7 collisions
polyethylene CH2   ξ 0.913    19.9 collisions

moderator   σ of one gain   predicted sd of the count (σ/ξ)√(L/ξ)   naive √(L/ξ)
hydrogen     1.000           4.27                                4.27
deuterium    0.567           3.91                                5.01
carbon       0.096           6.55                               10.74

start at 10 MeV instead of 2: + 1.6 collisions in hydrogen, + 10.2 in carbon
Three consequences follow, and you need them every time.
Light wins, and fast. Hydrogen needs 18.2 collisions, deuterium 25.1, beryllium 88.1, carbon 115.3, and oxygen 151.7. Uranium-238 needs 2,172: to a neutron a heavy nucleus is a wall it bounces off with its energy intact, which is why the fuel cannot moderate itself. Water at 19.6 collisions and polyethylene at 19.9 are nearly as fast as pure hydrogen, and heavy water needs 35.7.
The start barely matters. The count grows with the logarithm of the energy ratio. A neutron born at 10 MeV instead of 2 MeV needs ln 5/ξ more collisions: 1.6 more in hydrogen, 10.2 more in carbon.
The last collision overshoots, and the spread depends on the step. ln(E₀/E)/ξ counts collisions as if the neutron could stop halfway through one. The real count is the first collision that takes the lethargy past 18.2, so its mean is higher. For hydrogen the excess is exactly one. Its gain −ln(U), with U uniform, is exponential with mean 1, the same law as the waiting times between radioactive decays. The number of collisions that fit below 18.2 is then Poisson with mean 18.2, like the number of decays counted in a fixed time, and the count is one more: mean 19.2, standard deviation √18.2 = 4.27.
That √n is special to hydrogen. In general the total lethargy after n collisions has the standard deviation σ√n, where σ is the standard deviation of a single gain. Dividing by ξ turns lethargy into collisions, so the count has the standard deviation
Carbon's gains are narrow, σ = 0.096 against ξ = 0.158, so its count is far more regular than a Poisson count: the rule gives 6.55 collisions, not √115.3 = 10.74. For deuterium it gives 3.91 against a naive 5.01. The heavier nuclei, with their shorter steps, overshoot by less than hydrogen's one collision; the next section measures by how much.
A moderator also has to leave the neutrons alive, and the collision count says nothing about that. Hydrogen absorbs some of the neutrons it slows and deuterium barely any, so a heavy-water reactor can afford 35.7 collisions where light water needs 19.6. Absorption is outside this tutorial.
See it in code
The check is a Monte Carlo simulation of 100,000 neutrons in each moderator, from the seeded generator of the first cell (Random numbers with numpy.random covers default_rng). Each collision draws U uniform on [0, 1) and multiplies the energy by 1 − (1 − α)U, the kept fraction of the idea section, uniform between α and 1. The cell adds up the lethargy gains with cumsum, finds for each neutron the first collision whose running total passes ln(E₀/E) = 18.2, and asserts that every neutron got there.
Show code
N, BATCH = 100_000, 10_000
K = {"hydrogen": 80, "deuterium": 80, "carbon": 250}         # more collisions than any neutron needs


def collisions(A, size, K):
    """Number of collisions each of `size` neutrons needs to get from E0 below E_TH."""
    U = rng.random((size, K))
    gain = -np.log(1 - (1 - alpha(A)) * U)                    # lethargy gained in each collision
    u = np.cumsum(gain, axis=1)                               # lethargy after 1, 2, ... collisions
    assert (u[:, -1] > L).all(), "some neutrons never reached thermal energy"
    return np.argmax(u > L, axis=1) + 1                       # first collision past the threshold


counts = {}
print("moderator   ξ      L/ξ    simulated mean   overshoot   sd (predicted)")
for name, A in MODERATORS.items():
    # in batches of 10,000, so that carbon's 250 columns stay at 20 MB
    n = np.concatenate([collisions(A, BATCH, K[name]) for _ in range(N // BATCH)])
    counts[name] = n
    sem = n.std(ddof=1) / np.sqrt(N)
    print(f"{name:9s}  {xi(A):5.3f}  {L / xi(A):6.1f}   {n.mean():7.2f} ± {sem:.3f}"
          f"     {n.mean() - L / xi(A):5.2f}     {n.std(ddof=1):5.2f} ({gain_sd(A) / xi(A) * np.sqrt(L / xi(A)):.2f})")

fig, ax = plt.subplots(figsize=(8, 3.5))
for name, A in MODERATORS.items():
    edges = np.arange(counts[name].min() - 0.5, counts[name].max() + 1.5)   # one bin per count, no empty floor
    ax.hist(counts[name], bins=edges, histtype="step", color=COLOR[name], lw=1.6)
    top = np.bincount(counts[name]).max()
    ax.vlines(L / xi(A), 0, top, color=MUTED, lw=1, ls="--")             # up to the peak, clear of the labels
    x_label = {"hydrogen": 1, "deuterium": 31, "carbon": 122}[name]
    ax.text(x_label, top * 1.03, f"{name}\nmean {counts[name].mean():.1f}",
            color=COLOR[name], ha="left", va="bottom")
ax.text(70, 3000, "dashed: ln(E₀/E)/ξ", color=MUTED, ha="center", va="center")
ax.set(xlim=(0, 150), ylim=(0, 12500), xlabel="collisions to reach 0.025 eV", ylabel="neutrons out of 100,000")
plt.show()
moderator   ξ      L/ξ    simulated mean   overshoot   sd (predicted)
hydrogen   1.000    18.2     19.21 ± 0.013      1.01      4.26 (4.27)
deuterium  0.725    25.1     25.88 ± 0.013      0.79      3.96 (3.91)
carbon     0.158   115.3    116.02 ± 0.021      0.68      6.54 (6.55)
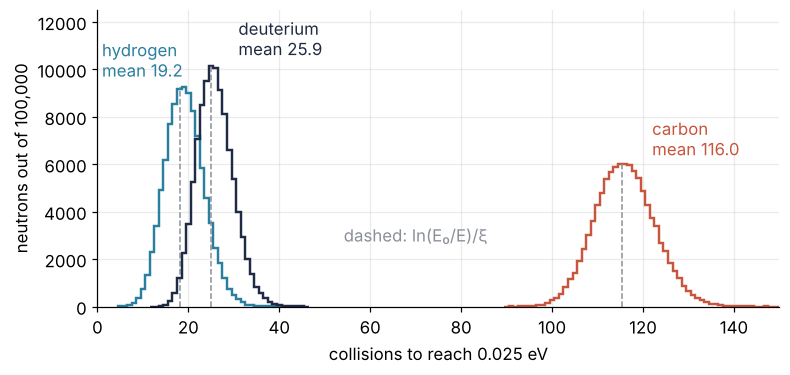
The means sit above ln(E₀/E)/ξ by 1.01, 0.79, and 0.68 collisions: the overshoot of the third consequence, exactly one for hydrogen, less for the heavier nuclei. The standard errors of the means, 0.013 to 0.021, are at least thirty times smaller than these differences, so the differences are real. The standard error of the mean says where the ± comes from, and Monte Carlo integration why it shrinks as 1/√N with N neutrons. The standard deviations, 4.26, 3.96, and 6.54, match the predicted 4.27, 3.91, and 6.55 to within 1.3 %. The one real miss is deuterium's standard deviation, 3.96 against 3.91, because the rule is a limit for many collisions and 25 is not many.
In the histogram, hydrogen and deuterium overlap below 45 collisions and carbon stands alone near 116, the widest peak in collisions and the narrowest relative to its mean, 6 % against 22 % for hydrogen. The title's 18 and 115 are the formula's counts.
Where it shows up
Wherever fast neutrons meet matter, the light nuclei decide what happens to them.
- Reactor design. Light-water reactors use ordinary water as moderator and coolant, CANDU reactors heavy water, and the British Magnox and the Soviet RBMK reactors graphite. Of the three, water slows neutrons in the fewest collisions but absorbs enough of them that the fuel has to be enriched, while heavy water and graphite absorb so little that CANDU and Magnox reactors run on natural uranium.
- Hydrology and geology. A cosmic-ray neutron sensor counts the fast and epithermal neutrons above a field, and the count falls as the soil gets wetter, because the hydrogen in the water slows them. A neutron porosity log lowers a neutron source and detectors into a borehole and reads the hydrogen in the pore water and oil, and from it the porosity of the rock.
- Neutron detection and shielding. A helium-3 counter detects thermal neutrons well and fast ones barely, so fast neutrons are slowed first. A Bonner sphere spectrometer puts such a detector inside polyethylene spheres of several diameters and reads the energy spectrum from how the count changes with the diameter, and neutron shields are polyethylene or water for the same reason.
- Medicine. Boron neutron capture therapy aims an epithermal beam at a tumor loaded with boron-10. The neutrons slow to thermal energies in the hydrogen of the tissue on their way in, and boron-10 captures them and splits into an alpha particle and a lithium nucleus whose range is about one cell diameter.
- Planetary science. Cosmic rays knock fast neutrons out of a planet's surface, and those that leak back to space carry the surface's composition with them. Lunar Prospector found hydrogen near the Moon's poles, and Mars Odyssey found it under the Martian surface, as a dip in the epithermal neutrons: where there is hydrogen, they have already slowed past that range.
In every case the same count carries over: hydrogen takes a fast neutron to thermal energies in about 20 collisions where anything heavier needs many more, so slow neutrons are a hydrogen detector.
Further reading
- Lamarsh and Baratta, Introduction to Nuclear Engineering, for neutron slowing down at the level of a first course.
- The NIST table of neutron scattering lengths and cross sections, the source of the bound-atom cross sections used above.
- Duderstadt and Hamilton, Nuclear Reactor Analysis, for slowing-down theory at the level of a reactor physics course.
- NumPy's random
Generatorfor the methods ofdefault_rng. - Related tutorials on this site: Random numbers with numpy.random: ten thousand reproducible random walks, for seeded generators; Monte Carlo integration: why the error falls as one over the square root of N, for Monte Carlo as an average; The standard error of the mean: why four times the data halves the error, for the ± on the simulated means; Matplotlib animation with FuncAnimation: a probe sweep as a small GIF, how the animation was built; planned: the same tutorial in Julia.
- Download the notebook. It was executed with the library versions in the header.