Earthquake location from three seismograms: circles, S minus P, and the misfit
Afterwards you can locate an earthquake and its depth from S minus P times and explain how a misfit turns circles into a least-squares point and error ellipse.
- Topic
- Inverse problems
- Field
- Geology
- Prerequisites
- none beyond Python basics
- Libraries
matplotlib 3.11.2numpy 2.5.4pooch 1.9.0scipy 1.18.1
py-earthquake-location.ipynb, executed with the versions above. The download needs a free account
Run it yourself. In a terminal, this installs exactly the versions above:
pip install numpy==2.5.4 pooch==1.9.0 scipy==1.18.1 matplotlib==3.11.2 jupyterlabPlay: locate a quake under the San Francisco Bay Area
An earthquake shakes the San Francisco Bay Area, and seismometers of the Berkeley network record it. On every seismogram the P wave arrives first and the S wave, the later and larger wiggle, follows, and every second of S minus P puts the quake 8.4 km farther away. That is enough for earthquake location. Drag each circle on the map, or the S mark on its record, until the S mark sits on the onset of the S wave: the circle's radius is then the distance. Drag the cross to where the circles meet. Play or Space replays the records, Landscape or L shades the misfit over the map, the answer button or A reveals the least-squares point and its ellipse, the round buttons or 1, 2, 3 switch rounds, and Reset or R starts the round over. In round 3 the depth slider, its − and + buttons, or the − and + keys set the depth. Keys work after a click into the game. Watch the misfit, in km: the circles never quite meet, so it never reaches zero.
Show code
// game.js: locate an earthquake under the San Francisco Bay Area from the S minus P delays on
// three or four seismograms. Units: km and s. The notebook writes the coastline, the stations,
// the records, and the answers into the #data element.
"use strict";

const DATA = JSON.parse(document.getElementById("data").textContent);
const {vp, vs} = DATA.speeds;
const K = (vp * vs) / (vp - vs);    // km of distance per s of S minus P: 8.4
const CELL = 6;                     // CSS px per cell of the misfit landscape
const LEVELS = [1, 2, 5];           // km, the landscape's contours
const FONT = "14px system-ui, sans-serif";
const $ = (id) => document.getElementById(id);
const stationsOf = (r) => DATA.rounds[r - 1].stations.map((code) => DATA.stations[code]);

// ---- the state: everything that changes, in one object; a round starts from its defaults
function defaults(r) {
  const S = stationsOf(r), mean = (key) => S.reduce((sum, s) => sum + s[key], 0) / S.length;
  return {round: r, clock: DATA.rounds[r - 1].record.length, playing: false, radius: S.map(() => 10),
    epi: [mean("x"), mean("y")], depth: 0, landscape: false, answer: false};
}
const state = defaults(1);
const R = () => DATA.rounds[state.round - 1];

// ---- one tick: the record clock follows real time, capped so that a background tab does not jump
function tick(dt) {
  state.clock += Math.min(dt, 0.05);
  if (state.clock >= R().record.length) {
    state.clock = R().record.length;
    state.playing = false;
  }
}

// ---- the misfit: RMS gap in km between a trial epicenter and the circles
const surfaceRadius = (r, z) => Math.sqrt(Math.max(r * r - z * z, 0));   // the circle on the map
function misfit(epi, radius, depth, stations) {
  let sum = 0;
  stations.forEach((s, i) => {
    const d = Math.hypot(epi[0] - s.x, epi[1] - s.y, depth);           // hypocentral distance
    sum += (radius[i] - d) ** 2;
  });
  return Math.sqrt(sum / stations.length);
}

// ---- layout: map and records sized to the frame; upright, wide, or short (a phone held sideways)
const mapCanvas = $("map"), recCanvas = $("rec");
const mctx = mapCanvas.getContext("2d"), rctx = recCanvas.getContext("2d");
let view = {};                      // sizes and the map's km-to-px transform, set by layout()
let landLayer = null;               // the land, drawn once per layout
let fog = {key: null};              // the landscape, kept until a circle, the depth, or the size changes

function fit(canvas, w, h) {
  const dpr = window.devicePixelRatio || 1;
  canvas.width = Math.round(w * dpr);
  canvas.height = Math.round(h * dpr);
  canvas.style.width = `${w}px`;
  canvas.style.height = `${h}px`;
  canvas.getContext("2d").setTransform(dpr, 0, 0, dpr, 0, 0);
}

function layout() {
  const W = document.documentElement.clientWidth, H = document.documentElement.clientHeight;
  const mode = H > W ? "upright" : H < 420 && W >= 600 ? "short" : "wide";
  const n = R().stations.length, axis = 24, box = $("mapbox"), rec = $("recbox"), side = $("side");
  document.body.className = `${mode}${R().depth ? " deep" : ""}`;
  const mw = mode === "upright" ? W : Math.round(Math.min(H, 0.56 * W));
  box.style.width = `${mw}px`;
  view.mode = mode;
  view.narrow = side.clientWidth < 420;               // a narrow side panel: shorter words, more lines
  const lines = mode === "upright" ? 1 : R().depth && view.narrow ? 3 : 2;
  $("answer-line").style.minHeight = `${1.3 * lines}em`;   // kept free: no jump when the answer shows
  updateControls();
  drawNumbers();                                      // the text in place before measuring
  let mh, rh;
  if (mode === "upright") {
    rh = n * 36 + axis;
    rec.style.height = `${rh}px`;
    mh = Math.max(200, H - side.offsetHeight);
  } else {
    mh = H;
    rec.style.height = "0px";                        // measure the rest, then give the records what is left
    const used = Math.max(...[...side.children].map((c) => c.getBoundingClientRect().bottom));
    rh = Math.min(n * 140 + axis, Math.max(n * 30 + axis, H - used - 10));
    rec.style.height = `${rh}px`;
  }
  box.style.height = `${mh}px`;
  fit(mapCanvas, mw, mh);
  fit(recCanvas, rec.clientWidth, rh);
  const [x0, x1, y0, y1] = R().view;
  const scale = Math.min(mw / (x1 - x0), mh / (y1 - y0));   // px per km: the round's view box fits
  rctx.font = FONT;
  const col = Math.ceil(rctx.measureText("000.00 s").width) + 10;   // the readouts' column
  view = {...view, mw, mh, rw: rec.clientWidth, rh, axis, col, scale, cx: (x0 + x1) / 2, cy: (y0 + y1) / 2};
  landLayer = drawLand();
  fog.key = null;
  render();
}

const toPx = (x, y) => [view.mw / 2 + (x - view.cx) * view.scale, view.mh / 2 - (y - view.cy) * view.scale];
const toKm = (px, py) => [view.cx + (px - view.mw / 2) / view.scale, view.cy - (py - view.mh / 2) / view.scale];
const color = (name) => getComputedStyle(document.documentElement).getPropertyValue(`--${name}`).trim();

function layer() {                                    // an offscreen canvas the size of the map
  const c = document.createElement("canvas"), dpr = window.devicePixelRatio || 1;
  c.width = mapCanvas.width;
  c.height = mapCanvas.height;
  const ctx = c.getContext("2d");
  ctx.setTransform(dpr, 0, 0, dpr, 0, 0);
  return [c, ctx];
}

function drawLand() {                                 // water a muted tint, land the page, coast in ink
  const [c, ctx] = layer();
  ctx.fillStyle = color("bg");
  ctx.fillRect(0, 0, view.mw, view.mh);
  ctx.globalAlpha = 0.18;
  ctx.fillStyle = color("muted");
  ctx.fillRect(0, 0, view.mw, view.mh);
  ctx.globalAlpha = 1;
  ctx.beginPath();
  for (const ring of DATA.land) {
    for (let k = 0; k < ring.length; k += 2) ctx[k ? "lineTo" : "moveTo"](...toPx(ring[k], ring[k + 1]));
    ctx.closePath();
  }
  ctx.fillStyle = color("bg");
  ctx.fill();
  ctx.strokeStyle = color("ink");
  ctx.lineWidth = 1;
  ctx.stroke();
  return c;
}

// The landscape: the misfit at the center of every cell, a fog that thickens away from the floor,
// and contours by marching squares (in each square of four cell centers, join the edge crossings).
const CORNER = [[0, 0], [1, 0], [1, 1], [0, 1]];
function drawFog() {
  const cols = Math.ceil(view.mw / CELL), rows = Math.ceil(view.mh / CELL), S = stationsOf(state.round);
  const m = new Float64Array(cols * rows);
  for (let j = 0; j < rows; j++) for (let i = 0; i < cols; i++) {
    m[j * cols + i] = misfit(toKm((i + 0.5) * CELL, (j + 0.5) * CELL), state.radius, state.depth, S);
  }
  // the fog: one pixel per cell, then stretched with smoothing, so that it has no steps
  const floor = Math.min(...m), [c, ctx] = layer(), small = document.createElement("canvas");
  small.width = cols;
  small.height = rows;
  const img = new ImageData(cols, rows), ink = color("ink").match(/[0-9a-f]{2}/gi).map((h) => parseInt(h, 16));
  for (let k = 0; k < m.length; k++) img.data.set([...ink, 255 * Math.min(0.55, 0.14 * Math.log1p(m[k] - floor))], 4 * k);
  small.getContext("2d").putImageData(img, 0, 0);
  ctx.imageSmoothingEnabled = true;
  ctx.drawImage(small, 0, 0, cols * CELL, rows * CELL);
  ctx.strokeStyle = color("muted");
  ctx.lineWidth = 1.2;
  ctx.beginPath();
  const labels = LEVELS.map((level) => ({level, x0: Infinity, x1: -Infinity, at: null}));
  for (const label of labels) for (let j = 0; j < rows - 1; j++) for (let i = 0; i < cols - 1; i++) {
    const level = label.level;
    const v = CORNER.map(([di, dj]) => m[(j + dj) * cols + i + di]), pts = [];
    for (let e = 0; e < 4; e++) {
      const a = v[e], b = v[(e + 1) % 4], [xa, ya] = CORNER[e], [xb, yb] = CORNER[(e + 1) % 4];
      if ((a < level) === (b < level)) continue;
      const f = (level - a) / (b - a);
      pts.push([(i + 0.5 + xa + f * (xb - xa)) * CELL, (j + 0.5 + ya + f * (yb - ya)) * CELL]);
    }
    for (let k = 0; k + 1 < pts.length; k += 2) {
      ctx.moveTo(...pts[k]);
      ctx.lineTo(...pts[k + 1]);
    }
    for (const [x, y] of pts) {                     // the label goes where the contour reaches farthest to the lower left
      label.x0 = Math.min(label.x0, x);
      label.x1 = Math.max(label.x1, x);
      if (!label.at || y - x > label.at[1] - label.at[0]) label.at = [x, y];
    }
  }
  ctx.stroke();
  return {layer: c, labels: labels.filter((l) => l.x1 - l.x0 >= 60)};   // too small a contour stays unlabeled
}

// ---- drawing the map
function knob(s, rho, epi) {                          // the visible rim point farthest from the cross
  let best = null;
  for (let k = 0; k < 120; k++) {
    const t = (k * Math.PI) / 60, [px, py] = toPx(s.x + rho * Math.cos(t), s.y + rho * Math.sin(t));
    const far = Math.hypot(px - epi[0], py - epi[1]);
    if (px > 10 && px < view.mw - 10 && py > 10 && py < view.mh - 10 && (!best || far > best[2])) best = [px, py, far];
  }
  return best;
}

function text(ctx, str, x, y, fill, align = "left") {   // text with a halo in the page color
  ctx.textAlign = align;
  ctx.lineWidth = 3;
  ctx.strokeStyle = color("bg");
  ctx.strokeText(str, x, y);
  ctx.fillStyle = fill;
  ctx.fillText(str, x, y);
}

function drawMap() {
  const ctx = mctx, S = stationsOf(state.round), A = R().answer, rec = R().record;
  const ink = color("ink"), second = color("second"), accent = color("accent"), muted = color("muted");
  ctx.drawImage(landLayer, 0, 0, view.mw, view.mh);
  if (state.landscape) {
    const key = [state.round, state.depth, ...state.radius, view.mw, view.mh].join();
    if (fog.key !== key) fog = {key, ...drawFog()};
    ctx.drawImage(fog.layer, 0, 0, view.mw, view.mh);
  }
  ctx.font = FONT;
  ctx.lineJoin = "round";
  const bar = 10 * view.scale;                        // the scale bar
  ctx.fillStyle = color("bg");                        // a halo, so that the bar shows in the fog
  ctx.fillRect(10, view.mh - 16, bar + 4, 6);
  ctx.fillStyle = muted;
  ctx.fillRect(12, view.mh - 14, bar, 2);
  text(ctx, "10 km", 12 + bar / 2, view.mh - 20, muted, "center");
  if (view.mw >= 400) for (const p of DATA.places) {   // place names, kept inside the map
    const [px, py] = toPx(p.x, p.y), half = ctx.measureText(p.name).width / 2 + 4;
    text(ctx, p.name, Math.min(view.mw - half, Math.max(half, px)), py, muted, "center");
  }

  // stations, and a ring that grows and fades as the replay passes each onset, small for P, large for S
  S.forEach((s, i) => {
    const [px, py] = toPx(s.x, s.y);
    for (const [onset, size] of [[rec.p[i], 16], [A.s[i], 30]]) {
      const age = state.clock - onset;
      if (age < 0 || age > 1) continue;
      ctx.globalAlpha = 1 - age;
      ctx.strokeStyle = ink;
      ctx.lineWidth = 2;
      ctx.beginPath();
      ctx.arc(px, py, 6 + size * age, 0, 2 * Math.PI);
      ctx.stroke();
      ctx.globalAlpha = 1;
    }
    ctx.fillStyle = ink;
    ctx.beginPath();
    ctx.moveTo(px, py - 8);
    ctx.lineTo(px + 7, py + 5);
    ctx.lineTo(px - 7, py + 5);
    ctx.fill();
    const right = px < view.mw - 50;                  // codes beside the station, inside the map
    text(ctx, R().stations[i], right ? px + 9 : px - 9, py - 6, ink, right ? "left" : "right");
  });

  // the circles at their surface radius, each with a knob; a circle smaller than the depth is a ring
  const [ex, ey] = toPx(...state.epi);
  view.knobs = S.map((s, i) => {
    const rho = surfaceRadius(state.radius[i], state.depth), [px, py] = toPx(s.x, s.y);
    ctx.strokeStyle = second;
    ctx.lineWidth = 1.6;
    ctx.beginPath();
    ctx.arc(px, py, rho > 0 ? rho * view.scale : 11, 0, 2 * Math.PI);
    ctx.stroke();
    const k = rho > 0 ? knob(s, rho, [ex, ey]) : null;
    if (k) {
      ctx.fillStyle = second;
      ctx.beginPath();
      ctx.arc(k[0], k[1], 7, 0, 2 * Math.PI);
      ctx.fill();
    }
    return k;
  });
  if (state.landscape) for (const {level, at: [x, y]} of fog.labels) {   // over the circles, under the answer
    text(ctx, `${level} km`, Math.min(view.mw - 24, Math.max(24, x)), Math.min(view.mh - 6, Math.max(18, y + 5)), muted, "center");
  }

  if (state.answer) {                                 // least squares, its 95 % ellipse, and the truth
    const [lx, ly] = toPx(A.ls[0], A.ls[1]), th = (A.ellipse.angle_deg * Math.PI) / 180;
    ctx.strokeStyle = accent;
    ctx.lineWidth = 1.6;
    ctx.beginPath();
    for (let k = 0; k <= 72; k++) {
      const t = (k * Math.PI) / 36, u = A.ellipse.a * Math.cos(t), v = A.ellipse.b * Math.sin(t);
      ctx.lineTo(...toPx(A.ls[0] + u * Math.cos(th) - v * Math.sin(th), A.ls[1] + u * Math.sin(th) + v * Math.cos(th)));
    }
    ctx.stroke();
    ctx.fillStyle = accent;
    ctx.beginPath();
    ctx.arc(lx, ly, 4, 0, 2 * Math.PI);
    ctx.fill();
    text(ctx, "least squares", lx + 8, ly + 18, accent);
    const [tx, ty] = toPx(A.truth[0], A.truth[1]);
    ctx.strokeStyle = muted;
    ctx.setLineDash([3, 3]);
    ctx.beginPath();
    ctx.arc(tx, ty, 7, 0, 2 * Math.PI);
    ctx.stroke();
    ctx.setLineDash([]);
    text(ctx, "true", tx - 10, ty - 8, muted, "right");
  }

  ctx.lineCap = "round";                              // the cross: a halo, then the line
  for (const [w, c] of [[5, color("bg")], [2.2, second]]) {
    ctx.strokeStyle = c;
    ctx.lineWidth = w;
    ctx.beginPath();
    ctx.moveTo(ex - 9, ey - 9); ctx.lineTo(ex + 9, ey + 9);
    ctx.moveTo(ex - 9, ey + 9); ctx.lineTo(ex + 9, ey - 9);
    ctx.stroke();
  }
  ctx.lineCap = "butt";
}

// ---- drawing the records: one row per station on the round's clock, P tick, S mark, and in a
// column of their own at the right the readouts, S minus P and the radius it gives
const GUTTER = 48;
const traceWidth = () => view.rw - GUTTER - view.col;
const timeToPx = (t) => GUTTER + (t / R().record.length) * traceWidth();
const rowHeight = () => (view.rh - view.axis) / R().stations.length;

function drawRecords() {
  const ctx = rctx, rec = R().record, A = R().answer, h = rowHeight();
  const ink = color("ink"), second = color("second"), muted = color("muted");
  ctx.clearRect(0, 0, view.rw, view.rh);
  ctx.font = FONT;
  ctx.lineJoin = "round";
  const upto = Math.round(state.clock * rec.rate);
  rec.traces.forEach((trace, i) => {
    const mid = (i + 0.5) * h, amp = 0.42 * h;
    text(ctx, R().stations[i], 4, mid + 5, ink);
    ctx.strokeStyle = ink;
    ctx.lineWidth = 1;
    ctx.beginPath();
    for (let k = 0; k < Math.min(upto, trace.length); k++) ctx.lineTo(timeToPx(k / rec.rate), mid - amp * trace[k]);
    ctx.stroke();
    const tick = (t, c, label, w) => {
      const x = timeToPx(t);
      ctx.fillStyle = c;
      ctx.fillRect(x - w / 2, i * h + 3, w, h - 6);
      text(ctx, label, x + 3, i * h + 15, c);
    };
    tick(rec.p[i], muted, "P", 1);
    if (state.answer) tick(A.s[i], muted, "", 1);
    const sMark = Math.min(rec.length, rec.p[i] + state.radius[i] / K);
    tick(sMark, second, "S", 2.5);
    text(ctx, `${(state.radius[i] / K).toFixed(2)} s`, view.rw - 4, mid - 2, second, "right");
    text(ctx, `${state.radius[i].toFixed(1)} km`, view.rw - 4, mid + 12, second, "right");
  });
  if (state.clock < rec.length) {                     // the replay's present
    ctx.fillStyle = muted;
    ctx.fillRect(timeToPx(state.clock), 0, 1, view.rh - view.axis);
  }
  const y = view.rh - view.axis + 2;                  // the time axis
  ctx.fillStyle = muted;
  ctx.fillRect(GUTTER, y, traceWidth(), 1);
  for (let t = 0; t <= rec.length; t++) {
    ctx.fillRect(timeToPx(t), y, 1, t % 2 ? 3 : 5);
    if (t % 2 === 0 && timeToPx(t) < view.rw - 70) text(ctx, String(t), timeToPx(t), y + 18, muted, "center");
  }
  text(ctx, "time / s", view.rw - 4, y + 18, muted, "right");
}

// ---- the numbers and the controls
function insideEllipse(p, A) {
  const th = (A.ellipse.angle_deg * Math.PI) / 180, dx = p[0] - A.ls[0], dy = p[1] - A.ls[1];
  const u = dx * Math.cos(th) + dy * Math.sin(th), v = -dx * Math.sin(th) + dy * Math.cos(th);
  return (u / A.ellipse.a) ** 2 + (v / A.ellipse.b) ** 2 <= 1;
}

// A button whose label changes holds all its labels, the spare ones hidden but as wide as they are,
// so that no label moves a control: "Pause" is wider than "Play"
function labels(button, texts, shown) {
  if (button.dataset.texts !== texts.join("|")) {
    button.replaceChildren(...texts.map((t) => Object.assign(document.createElement("span"), {textContent: t})));
    button.dataset.texts = texts.join("|");
  }
  [...button.children].forEach((span, k) => { span.className = k === shown ? "" : "spare"; });
}

function updateControls() {
  const compact = view.mode !== "wide" || view.narrow;
  labels($("play"), ["Play", "Pause"], Number(state.playing));
  $("land").setAttribute("aria-pressed", String(state.landscape));
  labels($("ans"), compact ? ["Answer", "Hide"] : ["Show answer", "Hide answer"], Number(state.answer));
  document.querySelectorAll("[data-round]").forEach((b) => b.setAttribute("aria-pressed", String(+b.dataset.round === state.round)));
  $("title").textContent = R().name;
  $("depth").value = state.depth;
  $("depth-val").textContent = `${state.depth.toFixed(1)} km`;
}

function drawNumbers() {                             // the answer line: one line upright, else two or three
  const S = stationsOf(state.round), A = R().answer;
  $("misfit").textContent = `misfit ${misfit(state.epi, state.radius, state.depth, S).toFixed(2)} km`;
  let lines = [];
  if (state.answer) {
    const d = Math.hypot(state.epi[0] - A.ls[0], state.epi[1] - A.ls[1]).toFixed(1);
    const where = insideEllipse(state.epi, A) ? "inside" : "outside";
    const depth = `depth ${A.ls[2].toFixed(1)} ± ${A.depth95.toFixed(1)} km`;
    const cross = `cross ${d} km from least squares`, ellipse = `${where} the 95 % ellipse`;
    if (view.mode === "upright") {
      lines = [R().depth ? `${depth} · cross ${d} km off, ${where}` : `${d} km from least squares · ${where}`];
    } else if (R().depth) {
      lines = view.narrow ? [`${depth}, true ${A.truth[2]} km`, cross, ellipse] : [`${cross} · ${ellipse}`, `${depth}, true ${A.truth[2]} km`];
    } else {
      lines = view.narrow ? [cross, ellipse] : [`${cross} · ${ellipse}`, `semi-axes ${A.ellipse.a.toFixed(1)} and ${A.ellipse.b.toFixed(1)} km`];
    }
  }
  $("answer-line").textContent = lines.join("\n");
}

function render() {
  updateControls();
  drawMap();
  drawRecords();
  drawNumbers();
}

// ---- set: merge a partial state; a new round loads its defaults first
function set(partial) {
  const newRound = partial.round !== undefined && partial.round !== state.round;
  if (newRound) Object.assign(state, defaults(partial.round));
  Object.assign(state, partial);
  if (newRound) layout();
  else render();
}
const togglePlay = () => set({playing: !state.playing, clock: state.clock >= R().record.length ? 0 : state.clock});
const reset = () => { Object.assign(state, defaults(state.round)); render(); };
const deepen = (dz) => { if (R().depth) set({depth: Math.min(25, Math.max(0, state.depth + dz))}); };

$("play").addEventListener("click", togglePlay);
$("land").addEventListener("click", () => set({landscape: !state.landscape}));
$("ans").addEventListener("click", () => set({answer: !state.answer}));
$("reset").addEventListener("click", reset);
document.querySelectorAll("[data-round]").forEach((b) => b.addEventListener("click", () => set({round: +b.dataset.round})));
$("depth").addEventListener("input", (e) => set({depth: Number(e.target.value)}));
$("shallower").addEventListener("click", () => deepen(-0.5));
$("deeper").addEventListener("click", () => deepen(0.5));
document.addEventListener("keydown", (e) => {
  const actions = {" ": togglePlay, l: () => set({landscape: !state.landscape}), a: () => set({answer: !state.answer}),
    r: reset, 1: () => set({round: 1}), 2: () => set({round: 2}), 3: () => set({round: 3}),
    "-": () => deepen(-0.5), "+": () => deepen(0.5), "=": () => deepen(0.5)};
  const act = actions[e.key.toLowerCase()];
  const native = e.target instanceof HTMLButtonElement && e.key === " ";   // the focused button handles it
  if (act && !native && !e.ctrlKey && !e.metaKey) {
    e.preventDefault();
    act();
  }
});

// ---- dragging, by finger or mouse: a handle moves by the pointer's motion, so the finger
// never covers the point it places; the cross wins over a circle where both are within reach
let drag = null;
const at = (e, canvas) => {
  const box = canvas.getBoundingClientRect();
  return [e.clientX - box.left, e.clientY - box.top];
};

mapCanvas.addEventListener("pointerdown", (e) => {
  const p = at(e, mapCanvas), coarse = e.pointerType !== "mouse", S = stationsOf(state.round);
  const [ex, ey] = toPx(...state.epi);
  if (Math.hypot(p[0] - ex, p[1] - ey) <= (coarse ? 22 : 12)) {
    drag = {kind: "epi", start: p, epi: [...state.epi]};
  } else {
    let best = null;                                  // the nearest rim within the band
    S.forEach((s, i) => {
      const rho = surfaceRadius(state.radius[i], state.depth), [px, py] = toPx(s.x, s.y);
      const gap = Math.abs(Math.hypot(p[0] - px, p[1] - py) - rho * view.scale);
      if (rho > 0 && gap <= (coarse ? 14 : 8) && (!best || gap < best.gap)) best = {i, gap};
    });
    if (!best) return;
    const [x, y] = toKm(...p), s = S[best.i];
    drag = {kind: "circle", i: best.i, offset: surfaceRadius(state.radius[best.i], state.depth) - Math.hypot(x - s.x, y - s.y)};
  }
  mapCanvas.setPointerCapture(e.pointerId);
  e.preventDefault();
});

mapCanvas.addEventListener("pointermove", (e) => {
  if (!drag) return;
  const p = at(e, mapCanvas);
  if (drag.kind === "epi") {
    state.epi = [drag.epi[0] + (p[0] - drag.start[0]) / view.scale, drag.epi[1] - (p[1] - drag.start[1]) / view.scale];
  } else {
    const s = stationsOf(state.round)[drag.i], [x, y] = toKm(...p);
    const rho = Math.max(0, Math.hypot(x - s.x, y - s.y) + drag.offset);
    state.radius[drag.i] = Math.hypot(rho, state.depth);     // r² = ρ² + z²
  }
  render();
});

recCanvas.addEventListener("pointerdown", (e) => {
  const p = at(e, recCanvas), i = Math.floor(p[1] / rowHeight()), rec = R().record;
  if (i >= rec.p.length) return;
  const s0 = rec.p[i] + state.radius[i] / K;
  if (Math.abs(p[0] - timeToPx(s0)) > (e.pointerType === "mouse" ? 8 : 22)) return;   // not on an S mark: let it scroll
  drag = {kind: "s", i, start: p[0], s0};
  recCanvas.setPointerCapture(e.pointerId);
});

recCanvas.addEventListener("pointermove", (e) => {
  if (!drag || drag.kind !== "s") return;
  const rec = R().record, pOnset = rec.p, i = drag.i, pxPerS = traceWidth() / rec.length;
  const sMark = Math.min(rec.length, Math.max(pOnset[i], drag.s0 + (at(e, recCanvas)[0] - drag.start) / pxPerS));
  state.radius[i] = K * (sMark - pOnset[i]);                  // r = 8.4 km/s × (t_S − t_P)
  render();
});

for (const canvas of [mapCanvas, recCanvas]) {
  for (const type of ["pointerup", "pointercancel"]) canvas.addEventListener(type, () => { drag = null; });
}

// ---- the loop: only a replay moves by itself; everything else redraws when it changes
let last = null;
function frame(now) {
  const dt = last === null ? 0 : (now - last) / 1000;
  last = now;
  if (state.playing) {
    tick(dt);
    render();
  }
  requestAnimationFrame(frame);
}

window.addEventListener("resize", layout);
window.matchMedia("(prefers-color-scheme: dark)").addEventListener("change", layout);
layout();
requestAnimationFrame(frame);
window.game = {state, set, render};
Every second between P and S is 8.4 km
The stills on this page are drawn from the game's own data: seven stations of the Berkeley Digital Seismic Network, their elevations ignored, and three synthetic quakes whose true positions are known, the first two at the surface. Everything lives on a flat map in km, where the synthetic quakes were made, so the map adds no error.
Show code
import itertools
import json
from pathlib import Path

import numpy as np
import matplotlib.pyplot as plt
from matplotlib.patches import Ellipse
from matplotlib.patheffects import withStroke
from matplotlib.path import Path as MplPath
from matplotlib.transforms import Bbox
import pooch
from scipy.optimize import least_squares
from scipy.stats import chi2

plt.rcParams.update({
    "figure.figsize": (7, 3.6), "figure.dpi": 110,
    "axes.spines.top": False, "axes.spines.right": False,
    "axes.grid": True, "grid.alpha": 0.25,
    "font.size": 11, "lines.linewidth": 1.8,
})
INK, ACCENT, SECOND, MUTED = "#1f2a44", "#c8553d", "#2a7f9e", "#8a8f98"
HALO = [withStroke(linewidth=3, foreground="white")]  # keeps a label legible where it crosses a line

V_P, V_S = 6.0, 3.5                                  # km/s, a uniform upper crust
K = V_P * V_S / (V_P - V_S)                          # km of distance per s of S minus P
LAT0, LON0, R_EARTH = 37.62, -122.03, 6371.0         # the map's center / degrees, Earth's radius / km

def to_km(lat, lon):
    """A flat map in km about (LAT0, LON0): x east, y north."""
    return np.array([R_EARTH * np.cos(np.radians(LAT0)) * np.radians(np.asarray(lon) - LON0),
                     R_EARTH * np.radians(np.asarray(lat) - LAT0)])

# Berkeley Digital Seismic Network (BK), doi:10.7932/BDSN. Coordinates from the NCEDC FDSN
# station service, 2026-10-17. Elevations (up to 1.25 km at MHC) are ignored.
STATIONS = {
    "BKS": (37.876221, -122.23558, "Byerly Seismographic Vault, Berkeley"),
    "OXMT": (37.499359, -122.424309, "Ox Mountain"),
    "MHC": (37.34164, -121.64257, "Lick Observatory, Mount Hamilton"),
    "BDM": (37.953972, -121.86554, "Black Diamond Mines Park, Antioch"),
    "SM2B": (37.838745, -122.110222, "St. Mary's College borehole, Moraga"),
    "RVRP": (37.867413, -121.747376, "Round Valley Regional Preserve"),
    "LLNL": (37.68188, -121.71675, "Lawrence Livermore National Laboratory"),
}
XY = {code: to_km(lat, lon) for code, (lat, lon, _) in STATIONS.items()}
PLACES = {"San Francisco": (37.7749, -122.4194), "Oakland": (37.8044, -122.2712), "San Jose": (37.3382, -121.8863)}

# Three synthetic quakes (latitude, longitude, depth / km) and the reading error sigma / s of their delays.
ROUNDS = [
    dict(name="three stations", stations=["BKS", "OXMT", "MHC"], quake=(37.66, -122.08, 0.0), sigma=0.1, depth=False),
    dict(name="noisier, four", stations=["BKS", "OXMT", "MHC", "BDM"], quake=(37.50, -121.85, 0.0), sigma=0.3, depth=False),
    dict(name="how deep?", stations=["SM2B", "BDM", "RVRP", "LLNL"], quake=(37.78, -121.85, 12.0), sigma=0.1, depth=True),
]

# Natural Earth 1:10m land, v5.1.2, public domain: the world's coastlines, of which the bay needs a few hundred points.
pooch.get_logger().setLevel("WARNING")                      # no download message on the first run
path = pooch.retrieve(
    "https://raw.githubusercontent.com/nvkelso/natural-earth-vector/v5.1.2/geojson/ne_10m_land.geojson",
    known_hash="sha256:1ac90796408bc6ad6911d69448485d3c4dbf2190370080368a09976e1c9f7416",
)
BOX = Bbox.from_extents(-122.80, 37.00, -121.25, 38.30)    # lon, lat
land = []                                                   # rings of (x, y) in km
with open(path, encoding="utf-8") as f:
    for feature in json.load(f)["features"]:
        geometry = feature["geometry"]
        polygons = geometry["coordinates"] if geometry["type"] == "MultiPolygon" else [geometry["coordinates"]]
        for polygon in polygons:
            ring = np.array(polygon[0])
            if not BOX.overlaps(Bbox.from_extents(*ring.min(axis=0), *ring.max(axis=0))):
                continue
            clipped = MplPath(ring).clip_to_bbox(BOX)
            starts = np.flatnonzero(clipped.codes == MplPath.MOVETO)   # one clipped ring per MOVETO
            for part in np.split(np.arange(len(clipped.codes)), starts[1:]):
                keep = part[clipped.codes[part] != MplPath.CLOSEPOLY]
                land.append(to_km(clipped.vertices[keep, 1], clipped.vertices[keep, 0]).T)
BOX_KM = np.r_[to_km(BOX.y0, BOX.x0), to_km(BOX.y1, BOX.x1)][[0, 2, 1, 3]]   # x0, x1, y0, y1

print(f"ne_10m_land.geojson, {Path(path).stat().st_size / 1e6:.1f} MB: {sum(map(len, land))} vertices kept in "
      f"{len(land)} rings; {len(STATIONS)} stations; K = {K:.1f} km/s")
ne_10m_land.geojson, 10.2 MB: 462 vertices kept in 3 rings; 7 stations; K = 8.4 km/s
Show code
rng = np.random.default_rng(1560)
RATE = 50                                            # samples per s

def wavelet(tau, freq, amp, decay):
    """A decaying sine that starts at tau = 0."""
    on = tau >= 0
    return np.where(on, amp * np.exp(-np.where(on, tau, 0) / decay) * np.sin(2 * np.pi * freq * tau), 0.0)

# The reading errors of the three rounds come first, in order, then the noise of the records.
for R in ROUNDS:
    R["error"] = rng.normal(0, R["sigma"], len(R["stations"]))
for R in ROUNDS:
    R["S"] = np.array([XY[c] for c in R["stations"]])
    R["truth"] = np.r_[to_km(*R["quake"][:2]), R["quake"][2]]
    d = np.sqrt(np.sum((R["S"] - R["truth"][:2]) ** 2, axis=1) + R["truth"][2] ** 2)   # to the hypocenter / km
    R["delay"] = d / K + R["error"]                  # S minus P as the records show it / s
    t0 = (d / V_P).min() - 2.0                       # each record starts 2 s before the first P
    R["p"] = d / V_P - t0
    R["s"] = R["p"] + R["delay"]
    n = int(round((R["s"].max() + 3.0) * RATE))      # and ends 3 s after the last S
    R["t"] = np.arange(n) / RATE
    noise = 0.08 if R["sigma"] > 0.2 else 0.02
    traces = [wavelet(R["t"] - tp, 8, 0.3, 0.3) + wavelet(R["t"] - ts, 3, 1.0, 1.0) + rng.normal(0, noise, n)
              for tp, ts in zip(R["p"], R["s"])]
    R["traces"] = np.round([tr / np.abs(tr).max() for tr in traces], 2) + 0.0
    pad = 6.0                                        # the map's view: the stations plus 6 km
    R["view"] = np.r_[R["S"][:, 0].min() - pad, R["S"][:, 0].max() + pad, R["S"][:, 1].min() - pad, R["S"][:, 1].max() + pad]

# ---- the game's computations in Python, same names as in game.js
def surface_radius(r, z):
    return np.sqrt(np.maximum(r**2 - z**2, 0))

def misfit(epi, radius, depth, S):
    """RMS gap / km between a trial epicenter and the circles; epi may be a grid of shape (2, ...)."""
    gaps = [r - np.sqrt((epi[0] - s[0]) ** 2 + (epi[1] - s[1]) ** 2 + depth**2) for r, s in zip(radius, S)]
    return np.sqrt(np.mean(np.square(gaps), axis=0))

def crossings(S, radius):
    """Of each pair of circles that crosses, the crossing closer to the other circles."""
    points = []
    for i, j in itertools.combinations(range(len(S)), 2):
        d = np.linalg.norm(S[j] - S[i])
        if not abs(radius[i] - radius[j]) <= d <= radius[i] + radius[j]:
            continue                                 # these two circles do not cross
        a = (radius[i] ** 2 - radius[j] ** 2 + d**2) / (2 * d)
        e = (S[j] - S[i]) / d
        h = np.sqrt(radius[i] ** 2 - a**2) * np.array([-e[1], e[0]])
        pair = [S[i] + a * e + h, S[i] + a * e - h]
        others = [k for k in range(len(S)) if k not in (i, j)]
        cost = [sum(abs(np.linalg.norm(q - S[k]) - radius[k]) for k in others) for q in pair]
        points.append(pair[int(np.argmin(cost))])
    return np.array(points)

def spread(points):
    return max(np.linalg.norm(a - b) for a, b in itertools.combinations(points, 2))

def label_contours(ax, cs, min_width):
    """A label on each contour where it reaches farthest to the lower left, as in the game; a contour
    too small to carry one gets it at its right end, by a leader."""
    small = 0
    for level, segments in zip(cs.levels, cs.allsegs):
        if not segments:
            continue
        points = np.vstack(segments)
        if np.ptp(points[:, 0]) >= min_width:
            x, y = points[np.argmin(points[:, 0] + points[:, 1])]
            ax.text(x, y, f"{level:g} km", color=MUTED, ha="center", va="center", zorder=6, path_effects=HALO)
        else:
            ax.annotate(f"{level:g} km", points[np.argmax(points[:, 0])], xytext=(40, 16 - 26 * small),
                        textcoords="offset points", color=MUTED, va="center", zorder=6, path_effects=HALO,
                        arrowprops=dict(arrowstyle="-", color=MUTED, lw=0.8, shrinkA=2, shrinkB=0))
            small += 1

def draw_map(ax, R, radius, depth=0.0, epi=None, view=None, landscape=False, contours=True, answer=None, scale_bar=True):
    """The game's map of round R with Matplotlib: land, stations, circles, cross, fog, answer."""
    x0, x1, y0, y1 = R["view"] if view is None else view
    ax.add_patch(plt.Rectangle((x0, y0), x1 - x0, y1 - y0, color=MUTED, alpha=0.18, lw=0, zorder=0))   # water
    ax.add_patch(plt.Rectangle((x0, y0), x1 - x0, y1 - y0, fill=False, ec=MUTED, lw=0.8, zorder=7))   # the map's edge
    for ring in land:
        ax.fill(*ring.T, color="white", lw=0, zorder=0.5)
        ax.plot(*np.vstack([ring, ring[:1]]).T, color=INK, lw=0.8, zorder=0.6)
    if landscape:
        X, Y = np.meshgrid(np.linspace(x0, x1, 300), np.linspace(y0, y1, 300))
        m = misfit((X, Y), radius, depth, R["S"])
        fog = np.zeros((*m.shape, 4))
        fog[..., :3] = plt.matplotlib.colors.to_rgb(INK)
        fog[..., 3] = np.minimum(0.55, 0.14 * np.log1p(m - m.min()))
        ax.imshow(fog, extent=(x0, x1, y0, y1), origin="lower", zorder=1, interpolation="bilinear")
        if contours:
            cs = ax.contour(X, Y, m, levels=[1, 2, 5], colors=MUTED, linewidths=1, zorder=1.5)
            label_contours(ax, cs, min_width=0.08 * (x1 - x0))
    for code, s, r in zip(R["stations"], R["S"], radius):
        rho = surface_radius(r, depth)
        if rho > 0:
            ax.add_patch(plt.Circle(s, rho, fill=False, color=SECOND, lw=1.4, zorder=2))
        ax.plot(*s, "^", ms=9, color=INK, zorder=3)
        right = s[0] < x1 - 0.12 * (x1 - x0)                   # the code beside the station, inside the map
        ax.annotate(code, s, xytext=(6 if right else -6, 4), textcoords="offset points", color=INK, zorder=3,
                    ha="left" if right else "right", path_effects=HALO)
    if answer is not None:
        a, b, angle = answer["ellipse"]
        ax.add_patch(Ellipse(answer["ls"][:2], 2 * a, 2 * b, angle=angle, fill=False, color=ACCENT, lw=1.6, zorder=4))
        ax.plot(*answer["ls"][:2], "o", ms=6, color=ACCENT, zorder=4)
        ax.plot(*R["truth"][:2], "o", ms=11, mfc="none", mec=MUTED, mew=1.2, ls="none", zorder=4)
    if epi is not None:
        ax.plot(*epi, "x", ms=10, mew=2.2, color=SECOND, zorder=5)
    if scale_bar:
        bx, by = x0 + 0.09 * (x1 - x0), y0 + 0.05 * (y1 - y0)       # right of round 1's bay shore
        ax.plot([bx, bx + 10], [by, by], color=MUTED, lw=2, solid_capstyle="butt", zorder=5,
                path_effects=[withStroke(linewidth=6, foreground="white")])
        ax.text(bx + 5, by + 0.015 * (y1 - y0), "10 km", color=MUTED, ha="center", va="bottom", zorder=5, path_effects=HALO)
    ax.set(xlim=(x0, x1), ylim=(y0, y1), aspect="equal")
    ax.set_axis_off()

def draw_records(ax, R, radius):
    """The game's records of round R: traces, P ticks, S marks at P + r/K, readouts at the right."""
    for i, (code, trace) in enumerate(zip(R["stations"], R["traces"])):
        y = -2.4 * i
        ax.plot(R["t"], y + trace, color=INK, lw=0.8)
        ax.plot([R["p"][i]] * 2, [y - 1.1, y + 1.1], color=MUTED, lw=1)
        ax.text(R["p"][i], y + 1.15, " P", color=MUTED, va="bottom")
        s_mark = R["p"][i] + radius[i] / K
        ax.plot([s_mark] * 2, [y - 1.1, y + 1.1], color=SECOND, lw=2)
        ax.text(s_mark, y + 1.15, " S", color=SECOND, va="bottom")
        ax.annotate(f"{radius[i] / K:.2f} s\n{radius[i]:.1f} km", (1.01, y), xycoords=("axes fraction", "data"),
                    color=SECOND, va="center", ha="left", linespacing=1.3)
    ax.set_yticks(-2.4 * np.arange(len(R["stations"])), R["stations"])
    ax.tick_params(axis="y", length=0)
    ax.spines["left"].set_visible(False)
    ax.grid(False, axis="y")
    ax.set(xlabel="time / s", xlim=(0, R["t"][-1]))

for i, R in enumerate(ROUNDS, 1):
    print(f"round {i}: {', '.join(R['stations']):22s} sigma = {R['sigma']} s, records of {R['t'][-1] + 1 / RATE:.1f} s")
round 1: BKS, OXMT, MHC         sigma = 0.1 s, records of 15.5 s
round 2: BKS, OXMT, MHC, BDM    sigma = 0.3 s, records of 15.9 s
round 3: SM2B, BDM, RVRP, LLNL  sigma = 0.1 s, records of 9.7 s
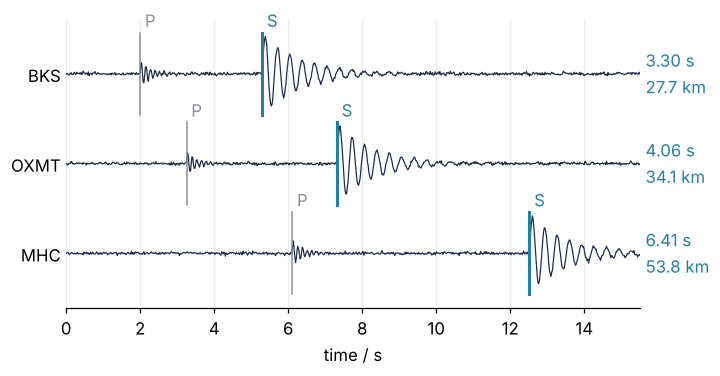
Here are the records of round 1, each S mark set on its S onset. The far station's S wave trails its P by almost twice as long as the near one's:
Show code
R1 = ROUNDS[0]
fig, ax = plt.subplots(figsize=(7, 3.4))
draw_records(ax, R1, K * R1["delay"])
fig.subplots_adjust(right=0.87)
plt.show()
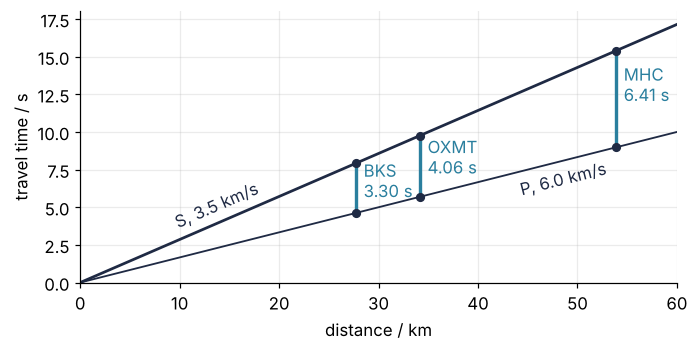
Both waves leave the quake at the same moment. The S wave is slower, so it falls behind by the same amount for every kilometer it travels, and the delay is a distance, the way the gap between lightning and thunder is. Over a distance \(d\),
With \(v_P\) = 6.0 km/s and \(v_S\) = 3.5 km/s, typical speeds of the upper crust with a ratio of 1.71, the factor \(K\) is 8.4 km/s. S minus P needs no origin time, the moment the quake started, so a single record gives a distance. Plot travel time against distance and the two waves are two lines fanning out from zero; each station's delay is the gap between them:
Show code
fig, ax = plt.subplots(figsize=(7, 3.2))
d = np.linspace(0, 60, 2)
ax.plot(d, d / V_P, color=INK, lw=1.2)
ax.plot(d, d / V_S, color=INK, lw=1.8)
for v, x, offset, va in [(V_P, 44, -0.5, "top"), (V_S, 10, 0.5, "bottom")]:   # each label along its line
    ax.text(x, x / v + offset, f"{'P' if v == V_P else 'S'}, {v} km/s", color=INK, va=va, rotation=np.degrees(np.arctan(1 / v)),
            rotation_mode="anchor", transform_rotates_text=True)
for code, r in zip(R1["stations"], K * R1["delay"]):
    ax.plot([r, r], [r / V_P, r / V_S], color=SECOND, lw=2.2)          # S minus P in SECOND, as the S marks
    ax.plot([r, r], [r / V_P, r / V_S], "o", ms=5, color=INK)
    ax.text(r + 0.8, r / V_P + 0.65 * r / K, f"{code}\n{r / K:.2f} s", color=SECOND, va="center")
ax.set(xlabel="distance / km", ylabel="travel time / s", xlim=(0, 60), ylim=(0, 18))
plt.show()
print(f"K = {V_P} × {V_S} / ({V_P} - {V_S}) = {K:.2f} km/s;  vP / vS = {V_P / V_S:.2f};  gap per km = {1 / K:.3f} s")
for code, delay in zip(R1["stations"], R1["delay"]):
    print(f"{code:5s} S minus P = {delay:.2f} s  ->  r = {K * delay:5.1f} km")
print(f"0.1 s of reading error moves a circle by {K * 0.1:.2f} km")
K = 6.0 × 3.5 / (6.0 - 3.5) = 8.40 km/s;  vP / vS = 1.71;  gap per km = 0.119 s
BKS   S minus P = 3.30 s  ->  r =  27.7 km
OXMT  S minus P = 4.06 s  ->  r =  34.1 km
MHC   S minus P = 6.41 s  ->  r =  53.8 km
0.1 s of reading error moves a circle by 0.84 km
The gap grows by 0.119 s per km, so MHC, with 6.41 s, is 53.8 km away and BKS, with 3.30 s, only 27.7 km. A tenth of a second of reading error moves a circle by 0.84 km.
The circles never meet in one point
Set the three circles to the delays in the records and they cross in pairs, but the three crossings form a small triangle, not a point. The inset zooms on it:
Show code
r1 = K * R1["delay"]
cross1 = crossings(R1["S"], r1)
guess1 = cross1.mean(axis=0)
fig, ax = plt.subplots(figsize=(7, 5.6))
draw_map(ax, R1, r1)
zoom = np.r_[guess1[0] - 5, guess1[0] + 5, guess1[1] - 5, guess1[1] + 5]
inset = ax.inset_axes([0.64, 0.30, 0.34, 0.40])
draw_map(inset, R1, r1, view=zoom, scale_bar=False)
inset.plot(*cross1.T, "o", ms=5, color=SECOND, zorder=6)
inset.plot(*guess1, "x", ms=9, mew=2, color=SECOND, zorder=6)
inset.text(0.04, 0.04, "10 × 10 km", transform=inset.transAxes, color=MUTED, zorder=8, path_effects=HALO)
ax.indicate_inset_zoom(inset, edgecolor=MUTED, alpha=1, lw=1)
plt.show()
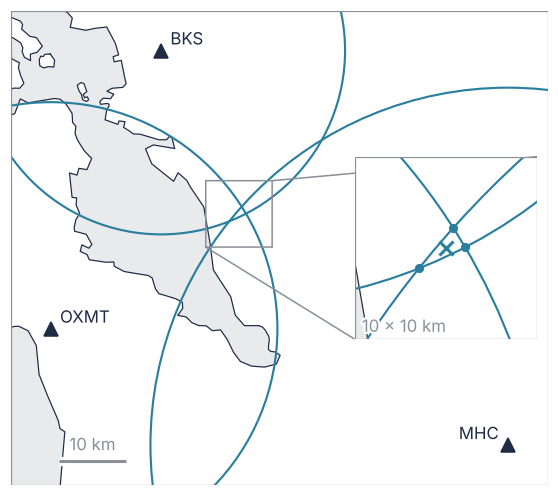
Each circle is one equation, \(|\mathbf{x} - \mathbf{s}_i| = r_i\) for the station at \(\mathbf{s}_i\), and the epicenter \(\mathbf{x}\) has two unknowns. Two circles pin it down up to a mirror pair of points. The third circle decides between the two, and it is one equation more than needed. With exact delays it would pass through the crossing anyway. But the delays carry errors, from a crust that is not exactly uniform and from onsets blurred by noise: σ = 0.1 s in round 1, or 0.84 km of radius. Every pair then crosses somewhere else, and the reading errors, not the geometry, keep the circles apart.
Of each pair of circles that crosses, take the crossing closer to the other circles, and skip pairs that do not cross. The centroid of these crossings is the geometric guess, what a player does by eye. It stands in for the player in the stills that follow.
R2 = ROUNDS[1]
r2 = K * R2["delay"]
cross2 = crossings(R2["S"], r2)
print(f"round 1: {len(cross1)} of 3 pairs cross, the crossings lie up to {spread(cross1):.1f} km apart")
print(f"round 1: geometric guess at ({guess1[0]:.2f}, {guess1[1]:.2f}) km, {np.linalg.norm(guess1 - R1['truth'][:2]):.2f} km from the true epicenter")
print(f"round 2: {len(cross2)} of 6 pairs cross, the crossings lie up to {spread(cross2):.1f} km apart")
round 1: 3 of 3 pairs cross, the crossings lie up to 2.9 km apart
round 1: geometric guess at (-6.39, 3.88) km, 2.07 km from the true epicenter
round 2: 4 of 6 pairs cross, the crossings lie up to 7.7 km apart
In round 1 the three crossings lie up to 2.9 km apart, and the guess lands 2.07 km from the true epicenter. Round 2, with σ = 0.3 s and four circles, is worse: only four of its six pairs cross at all, so the guess ignores a third of the pairs. More circles do not make the crossings meet. They make the question of which point fits best unavoidable.
The misfit is a valley, and least squares finds its floor
Press Landscape and a fog settles over the map, thick over points far from the circles and clearing toward one spot, with contours at 1, 2, and 5 km. Here is round 1 with the geometric guess:
Show code
fig, ax = plt.subplots(figsize=(7, 5.6))
draw_map(ax, R1, r1, epi=guess1, landscape=True)
plt.show()
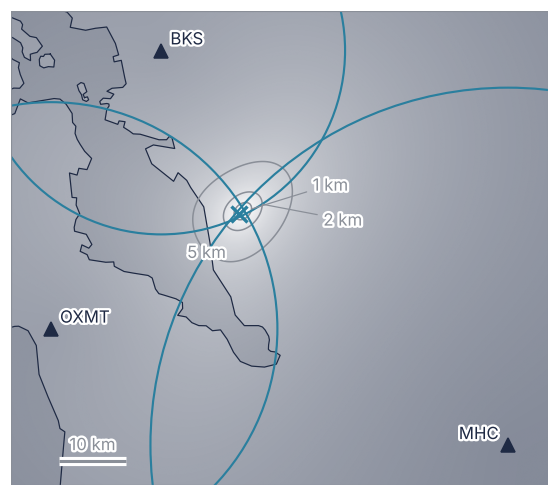
The fog is the misfit \(m\), in km: how far a trial epicenter is from each circle, squared, averaged over the \(N\) stations, and rooted,
It is zero only where all circles meet. Everywhere else it rises, and the map becomes a valley; Least squares says why the gaps are squared. Unlike the crossings, it counts every circle.
scipy.optimize.least_squares walks down to the floor of the valley. Its residual for a station is the measured delay minus the delay predicted for the trial point, divided by σ: \((\Delta t_i - |\mathbf{x} - \mathbf{s}_i|/K)/\sigma\). Dividing does not move the best point; it makes one reading error, \(K\sigma\) km on the map, the unit of the sum of squares, χ²:
Steep valley walls mean a well-pinned location; gentle walls let the epicenter wander. The 95 % ellipse is the contour of χ² that lies 5.99 above its floor, and 5.99 is the level that a sum of two squared reading errors, in units of σ, stays below 95 times in 100. Two, because the map draws two unknowns, \(x\) and \(y\), whatever the number of stations. On the map the ellipse is the landscape's contour at
between the 1 and 2 km contours. Least squares gets it without mapping the valley, from the covariance matrix \(C = (J^\mathsf{T} J)^{-1}\), with \(J\) the slopes of the residuals, res.jac. Its diagonal holds how much each unknown spreads, squared, and its other entries how much each pair spreads together. The ellipse points along the two directions in which the spreads do not mix, with half-lengths √5.99 times the spread along each.
The floor is the disagreement the best point cannot remove. With \(N\) stations and \(p\) unknowns, here two, it is expected near \(K\sigma\sqrt{(N - p)/N}\), because the best point has \(p\) unknowns to absorb reading errors with. For your own records, the floor divided by \(K\sqrt{(N - p)/N}\) gives a first estimate of σ, a rough one with one or two stations beyond \(p\). A floor several times its expected size says that σ or the speeds are wrong; the wrong crust in Variations shows one.
def locate(R):
    """Least-squares hypocenter of round R, its covariance, and its 95 % ellipse."""
    S, delay, sigma = R["S"], R["delay"], R["sigma"]

    def residuals(q):                                # in units of the reading error
        z = q[2] if R["depth"] else 0.0
        return (delay - np.sqrt(np.sum((S - q[:2]) ** 2, axis=1) + z**2) / K) / sigma

    start = np.r_[S.mean(axis=0), 5.0] if R["depth"] else S.mean(axis=0)
    res = least_squares(residuals, start, bounds=([-np.inf, -np.inf, 0.0][:start.size], np.inf))
    C = np.linalg.inv(res.jac.T @ res.jac)           # covariance of x, y (and z) / km²
    w, v = np.linalg.eigh(C[:2, :2])
    level = chi2.ppf(0.95, 2)                        # 5.99: two unknowns drawn on the map
    dx = R["truth"][:2] - res.x[:2]
    N, p = len(S), start.size
    floor = misfit(res.x[:2], K * delay, res.x[2] if R["depth"] else 0.0, S)
    return dict(ls=res.x, C=C, N=N, p=p, level=level,
                ellipse=(*np.sqrt(level * w[::-1]), np.degrees(np.arctan2(v[1, 1], v[0, 1])) % 180),
                inside=dx @ np.linalg.solve(C[:2, :2], dx), floor=floor,
                expected=K * sigma * np.sqrt((N - p) / N),
                m95=np.sqrt(floor**2 + level * (K * sigma) ** 2 / N))

fits = [locate(R) for R in ROUNDS]
for i, (R, fit) in enumerate(zip(ROUNDS[:2], fits[:2]), 1):
    a, b, angle = fit["ellipse"]
    print(f"round {i}: least squares at ({fit['ls'][0]:.2f}, {fit['ls'][1]:.2f}) km, "
          f"{np.linalg.norm(fit['ls'][:2] - R['truth'][:2]):.2f} km from the truth")
    print(f"         95 % ellipse: semi-axes {a:.2f} and {b:.2f} km, major axis at {angle:.0f}° from east; "
          f"truth at {fit['inside']:.2f} of {fit['level']:.2f}, {'inside' if fit['inside'] <= fit['level'] else 'outside'}")
    print(f"         misfit floor {fit['floor']:.2f} km, expected {fit['expected']:.2f} km; contour m95 = {fit['m95']:.2f} km")
print(f"round 1: geometric guess {np.linalg.norm(guess1 - fits[0]['ls']):.2f} km from least squares")
round 1: least squares at (-5.81, 4.30) km, 1.42 km from the truth
         95 % ellipse: semi-axes 2.01 and 1.47 km, major axis at 45° from east; truth at 3.97 of 5.99, inside
         misfit floor 0.48 km, expected 0.48 km; contour m95 = 1.28 km
round 2: least squares at (16.65, -11.23) km, 2.26 km from the truth
         95 % ellipse: semi-axes 6.18 and 3.56 km, major axis at 41° from east; truth at 1.16 of 5.99, inside
         misfit floor 1.83 km, expected 1.78 km; contour m95 = 3.59 km
round 1: geometric guess 0.71 km from least squares
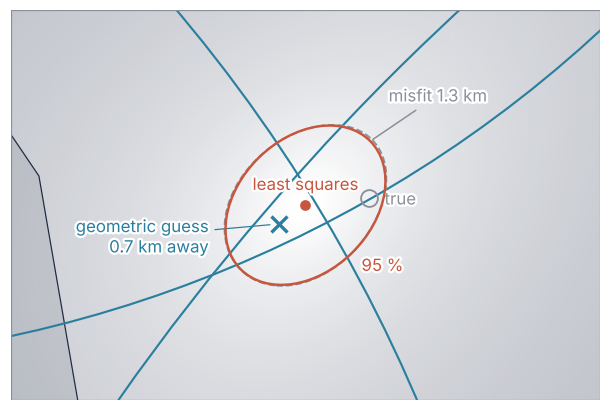
The least-squares point is 1.42 km from the truth, against 2.07 km for the guess, and the truth lies inside the ellipse. The floors match: 0.48 against 0.48 km in round 1, 1.83 against 1.78 km in round 2. Here is round 1's answer as the game draws it, with the \(m_{95}\) contour dashed, nearly on the ellipse:
Show code
fit1 = fits[0]
(lx, ly), (a, b, angle) = fit1["ls"], fit1["ellipse"]
zoom = np.r_[lx - 6.5, lx + 6.5, ly - 4.3, ly + 4.3]
fig, ax = plt.subplots(figsize=(7, 4.6))
draw_map(ax, R1, r1, epi=guess1, view=zoom, landscape=True, contours=False, answer=fit1, scale_bar=False)
X, Y = np.meshgrid(np.linspace(*zoom[:2], 300), np.linspace(*zoom[2:], 300))
ax.contour(X, Y, misfit((X, Y), r1, 0.0, R1["S"]), levels=[fit1["m95"]], colors=MUTED, linewidths=1.2,
           linestyles="--", zorder=3)
tip = (lx + a * np.cos(np.radians(angle)), ly + a * np.sin(np.radians(angle)))   # an end of the major axis
ax.annotate(f"misfit {fit1['m95']:.1f} km", tip, xytext=(12, 30), textcoords="offset points", color=MUTED,
            ha="left", va="center", path_effects=HALO, arrowprops=dict(arrowstyle="-", color=MUTED, lw=1, shrinkA=2))
ax.annotate("least squares", (lx, ly), xytext=(0, 10), textcoords="offset points", color=ACCENT, ha="center", path_effects=HALO)
side = (lx + b * np.cos(np.radians(angle - 90)), ly + b * np.sin(np.radians(angle - 90)))
ax.annotate("95 %", side, xytext=(6, -12), textcoords="offset points", color=ACCENT, path_effects=HALO)
ax.annotate("true", R1["truth"][:2], xytext=(10, 0), textcoords="offset points", color=MUTED, va="center", path_effects=HALO)
ax.annotate(f"geometric guess\n{np.linalg.norm(guess1 - fit1['ls'][:2]):.1f} km away", guess1, xytext=(-46, -8),
            textcoords="offset points", color=SECOND, ha="right", va="center", path_effects=HALO,
            arrowprops=dict(arrowstyle="-", color=SECOND, lw=0.8, shrinkA=2, shrinkB=6))
plt.show()
A deeper quake shrinks the circles until they meet
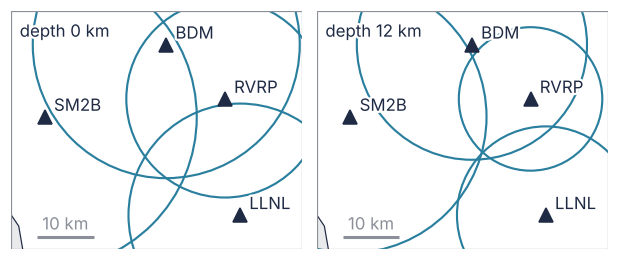
Round 3 puts its quake 12 km down, under four stations close to it. With the depth at 0 the circles are too large and overlap in a lens; at 12 km they meet near one point:
Show code
R3 = ROUNDS[2]
r3 = K * R3["delay"]
fig, axes = plt.subplots(1, 2, figsize=(7, 3.6), gridspec_kw=dict(wspace=0.05))
for ax, z in zip(axes, [0.0, 12.0]):
    draw_map(ax, R3, r3, depth=z, view=R3["view"] + [0, 5, 0, 0])   # room for the station codes
    ax.text(0.03, 0.96, f"depth {z:.0f} km", transform=ax.transAxes, color=INK, va="top", zorder=8, path_effects=HALO)
plt.show()
A delay measures the straight-line distance \(r\) to the hypocenter, the point where the rupture starts, not to the epicenter above it. For a quake \(z\) km down, the epicenter lies on the circle of surface radius
Sliding the depth down shrinks every circle, the near ones the most, until they meet. Least squares takes \(z\) as a third unknown, bounded at \(z \ge 0\).
The depth's spread \(\sigma_z\) is the square root of its diagonal entry in \(C\), now three by three. \(\pm 1.96\,\sigma_z\) is the 95 % range of one unknown, the counterpart of 5.99: 1.96² = 3.84 is the level that one squared error, in units of its spread, stays below 95 times in 100. The map's ellipse uses the part of \(C\) that belongs to \(x\) and \(y\) and stays at 5.99, since two unknowns are drawn:
fit3 = fits[2]
for z in [0.0, 12.0]:
    rho = surface_radius(r3, z)
    print(f"depth {z:4.1f} km: surface radii {', '.join(f'{x:.1f}' for x in rho)} km; "
          f"crossings up to {spread(crossings(R3['S'], rho)):.1f} km apart")
sigma_z = np.sqrt(fit3["C"][2, 2])
z95 = np.sqrt(chi2.ppf(0.95, 1)) * sigma_z            # 1.96 sigma_z
a, b, angle = fit3["ellipse"]
print(f"least squares: ({fit3['ls'][0]:.2f}, {fit3['ls'][1]:.2f}) km, depth {fit3['ls'][2]:.1f} ± {z95:.1f} km (95 %), "
      f"sigma_z = {sigma_z:.2f} km; true depth {R3['truth'][2]:.0f} km")
print(f"misfit floor {fit3['floor']:.2f} km, expected {fit3['expected']:.2f} km with p = {fit3['p']}")
print(f"map ellipse: semi-axes {a:.2f} and {b:.2f} km; truth at {fit3['inside']:.2f} of {fit3['level']:.2f}; "
      f"spreads along its axes {', '.join(f'{x:.2f}' for x in np.sqrt(np.linalg.eigvalsh(fit3['C'][:2, :2]))[::-1])} km")
depth  0.0 km: surface radii 27.0, 23.7, 17.5, 19.8 km; crossings up to 15.4 km apart
depth 12.0 km: surface radii 24.1, 20.4, 12.7, 15.8 km; crossings up to 2.5 km apart
least squares: (16.23, 17.38) km, depth 12.0 ± 1.7 km (95 %), sigma_z = 0.88 km; true depth 12 km
misfit floor 0.36 km, expected 0.42 km with p = 3
map ellipse: semi-axes 2.39 and 1.61 km; truth at 0.72 of 5.99; spreads along its axes 0.98, 0.66 km
Depth comes out as 12.0 ± 1.7 km at 95 %, about as sharp as the epicenter, whose ellipse has semi-axes of 2.39 and 1.61 km. The stations sit 13 to 24 km from the epicenter, comparable to the depth; for a distant station \(\rho \approx r - z^2/(2r)\) hardly changes with \(z\). With \(p\) = 3 the expected floor drops to 0.42 km; round 3 found 0.36.
For your own quake, locate needs station positions in km on a flat map, the S minus P delays, and σ; to_km in the first hidden cell converts latitude and longitude. The lines that read truth only grade this synthetic test.
How the game computes it
The state. Everything that changes lives in one object, in km and s: the round, the clock of the records, whether the replay plays, the circle radii, the epicenter, the depth, and the two overlays. A new round or Reset loads the defaults, every circle at 10 km, visibly wrong, and the cross at the stations' centroid:
  return {round: r, clock: DATA.rounds[r - 1].record.length, playing: false, radius: S.map(() => 10),
    epi: [mean("x"), mean("y")], depth: 0, landscape: false, answer: false};
The loop. Once per screen refresh the browser calls frame through requestAnimationFrame. While the replay plays, frame hands the real time since the last call to tick, which advances the clock, capped at 50 ms so that a background tab does not jump, and stops at the end of the record. The traces draw up to the clock, and each station pulses as the clock passes its P and S onsets. Nothing else moves by itself: a paused game redraws only after a drag, a button, a key, a resize, or a switch between light and dark.
function tick(dt) {
  state.clock += Math.min(dt, 0.05);
  if (state.clock >= R().record.length) {
    state.clock = R().record.length;
    state.playing = false;
  }
}
From the notebook into the game. The coastline comes from Natural Earth's 1:10m land polygons, version 5.1.2, public domain: a GeoJSON file of 10.2 MB from the project's GitHub repository, downloaded once with pooch and pinned by its SHA-256. The notebook clips it to the bay, 462 points, and writes it into the game file as JSON with the seven stations, the three rounds' records and P onsets, and the answers: the least-squares point, its ellipse, the true hypocenter, and the S onsets. The answers sit in the file, readable by anyone who looks, as a synthetic quake's truth may. The game reads it all from a <script type="application/json" id="data"> element and asks no server for anything, so a downloaded copy needs no connection.
The misfit, live. The number under the records and the landscape come from one function, the misfit section's formula with the distance to the hypocenter at the player's depth:
const surfaceRadius = (r, z) => Math.sqrt(Math.max(r * r - z * z, 0));   // the circle on the map
function misfit(epi, radius, depth, stations) {
  let sum = 0;
  stations.forEach((s, i) => {
    const d = Math.hypot(epi[0] - s.x, epi[1] - s.y, depth);           // hypocentral distance
    sum += (radius[i] - d) ** 2;
  });
  return Math.sqrt(sum / stations.length);
}
For the landscape the game evaluates it at the center of every 6-pixel cell of the map, shades the map by how far each misfit lies above the lowest one, blended between cell centers, and traces the 1, 2, and 5 km contours. It recomputes the grid only when a circle, the depth, or the frame's size changes, not when the cross moves.
Dragging. A finger and a mouse both send pointer events, so one set of handlers serves both. A drag moves a handle by the pointer's motion, not to its position, so the finger never covers the point it places, and the cross wins over a circle where both are within reach. Dragging an S mark sets the same radius as dragging its circle, by the first section's rule:
state.radius[i] = K * (sMark - pOnset[i]); // r = 8.4 km/s × (t_S − t_P)
The cell that writes the game. With fixed rounding and keys in alphabetical order, a rerun yields an identical file. It writes </ as <\/, because a </ inside the data would end the <script> element holding it too soon. The HTML and CSS around the game wait in the hidden cell above, with placeholders for the data and game.js.
Show code
TEMPLATE = """<!doctype html>
<html lang="en">
<head>
<meta charset="utf-8">
<meta name="viewport" content="width=device-width, initial-scale=1">
<title>Locate an earthquake under the San Francisco Bay Area</title>
<style>
:root { --bg: #ffffff; --fg: #1f2a44; --ink: #1f2a44; --accent: #c8553d; --second: #2a7f9e; --muted: #8a8f98; }
@media (prefers-color-scheme: dark) {
  :root { --bg: #141a2a; --fg: #e9ecf3; --ink: #c9d0e3; --accent: #e3826b; --second: #6ec1de; --muted: #8e97ab; }
}
html, body { margin: 0; height: 100%; overflow: hidden; background: var(--bg); color: var(--fg);
  font: 15px/1.3 system-ui, sans-serif; -webkit-text-size-adjust: 100%; }
body { display: flex; }
body.upright { flex-direction: column; font-size: 14px; }
#mapbox, #recbox { position: relative; flex: none; overflow: hidden; }
#mapbox::after { content: ""; position: absolute; inset: 0; pointer-events: none; box-shadow: inset -1px 0 0 var(--muted); }
body.upright #mapbox::after { box-shadow: inset 0 -1px 0 var(--muted); }   /* the map's edge where land meets it */
#map { touch-action: none; }
#rec { touch-action: pan-y; }
canvas { position: absolute; left: 0; top: 0; display: block; }
#side { flex: 1; min-width: 0; display: flex; flex-flow: row wrap; align-content: flex-start; gap: 6px 8px;
  padding: 8px 10px; box-sizing: border-box; }
#side > * { flex: 1 1 100%; }
#misfit { color: var(--accent); font-size: 26px; font-variant-numeric: tabular-nums; }
#answer-line { color: var(--accent); white-space: pre-line; }   /* its height is kept free by layout() */
#title { margin-left: 4px; }
.group { display: flex; flex-wrap: wrap; align-items: center; gap: 6px; }
.lab { margin-right: 2px; }
button { font: inherit; color: var(--bg); background: var(--second); border: 0; border-radius: 4px; padding: 0.25em 0.8em; }
button[aria-pressed=false] { color: var(--second); background: transparent; box-shadow: inset 0 0 0 1.5px var(--second); }
button.step { padding: 0; width: 2em; }
button > span { display: block; }   /* a label; the spare ones keep their width, not their height */
button > span.spare { height: 0; overflow: hidden; visibility: hidden; }
input[type=range] { flex: 1; min-width: 60px; margin: 0; accent-color: var(--second); }
#depth-val { min-width: 4em; text-align: right; font-variant-numeric: tabular-nums; }
#depth-row { display: none; }
body.deep #depth-row { display: flex; }
button, input { touch-action: manipulation; }
@media (pointer: coarse) { button { min-height: 44px; min-width: 44px; } input[type=range] { height: 44px; } }
body.upright #side { flex: none; padding: 4px 6px 6px; gap: 4px 6px; }
body.short #title { display: none; }
body.upright #misfit { font-size: 18px; }
body.upright #recbox { order: 1; } body.upright #misfit { order: 2; } body.upright #answer-line { order: 3; }
body.upright #actions { order: 4; } body.upright #rounds { order: 5; } body.upright #depth-row { order: 6; }
body.short #side { padding: 6px 8px; gap: 4px 8px; }
body.short #misfit { font-size: 22px; }
body.short #actions, body.short #rounds { flex: 0 1 auto; }
body.short #actions button { padding: 0.25em 0.6em; }   /* actions and rounds share one line */
body.short #rounds .lab { display: none; }
body.short #recbox { order: 1; } body.short #misfit { order: 2; } body.short #answer-line { order: 3; }
body.short #actions { order: 4; } body.short #rounds { order: 5; } body.short #depth-row { order: 6; }
</style>
</head>
<body>
<div id="mapbox"><canvas id="map" aria-label="Map with stations, circles, and the epicenter"></canvas></div>
<div id="side">
  <div class="group" id="rounds"><span class="lab">Round</span>
    <button data-round="1" aria-label="Round 1">1</button><button data-round="2" aria-label="Round 2">2</button><button
    data-round="3" aria-label="Round 3">3</button><span id="title"></span></div>
  <div id="recbox"><canvas id="rec" aria-label="Seismograms with P ticks and S marks"></canvas></div>
  <div id="misfit"></div>
  <div id="answer-line"></div>
  <div class="group" id="actions"><button id="play">Play</button><button id="land" aria-pressed="false">Landscape</button>
    <button id="ans">Show answer</button><button id="reset">Reset</button></div>
  <div class="group" id="depth-row"><label for="depth">Depth z</label>
    <button class="step" id="shallower" aria-label="Shallower">−</button><input id="depth" type="range" min="0" max="25" step="0.5">
    <button class="step" id="deeper" aria-label="Deeper">+</button><span id="depth-val"></span></div>
</div>
<script type="application/json" id="data">{{DATA}}</script>
<script>{{SCRIPT}}</script>
</body>
</html>
"""
def rounded(values, digits):
    return [round(float(v), digits) + 0.0 for v in np.ravel(values)]   # + 0.0 turns -0.0 into 0.0

game_data = {
    "source": {"land": "Natural Earth 1:10m land, v5.1.2, public domain",
               "stations": "Berkeley Digital Seismic Network, doi:10.7932/BDSN; NCEDC, 2026-10-17"},
    "region": {"lat0": LAT0, "lon0": LON0, "box": rounded(BOX_KM, 2)},
    "land": [rounded(ring, 2) for ring in land],
    "places": [{"name": name, "x": x, "y": y} for name, (x, y) in
               ((name, rounded(to_km(*ll), 2)) for name, ll in PLACES.items())],
    "stations": {code: {"site": site, "x": x, "y": y} for code, (_, _, site) in STATIONS.items()
                 for x, y in [rounded(XY[code], 3)]},
    "speeds": {"vp": V_P, "vs": V_S},
    "rounds": [{
        "name": R["name"], "stations": R["stations"], "sigma": R["sigma"], "depth": R["depth"],
        "view": rounded(R["view"], 2),
        "record": {"rate": RATE, "p": rounded(R["p"], 3), "length": round(len(R["t"]) / RATE, 2),
                   "traces": [rounded(tr, 2) for tr in R["traces"]]},
        "answer": {"ls": rounded(np.r_[fit["ls"][:2], fit["ls"][2] if R["depth"] else 0.0], 3),
                   "ellipse": dict(zip(["a", "b", "angle_deg"], rounded(fit["ellipse"], 3))),
                   "depth95": round(float(np.sqrt(chi2.ppf(0.95, 1) * fit["C"][-1, -1])), 3) if R["depth"] else 0.0,
                   "truth": rounded(R["truth"], 3), "s": rounded(R["s"], 3)},
    } for R, fit in zip(ROUNDS, fits)],
}
# sorted keys and fixed rounding: two runs write the same bytes; "<\/" keeps "</" out of the script element
data = json.dumps(game_data, sort_keys=True, separators=(",", ":")).replace("</", "<\\/")
script = Path("minigame/quake/game.js").read_text(encoding="utf-8")
html = TEMPLATE.replace("{{DATA}}", data).replace("{{SCRIPT}}", script)
Path("assets").mkdir(exist_ok=True)
Path("assets/quake.html").write_text(html, encoding="utf-8", newline="\n")
size = Path("assets/quake.html").stat().st_size
print(f"assets/quake.html: {sum(map(len, land))} coastline points, {sum(R['traces'].size for R in ROUNDS)} samples, {size / 1024:.0f} kB")
assets/quake.html: 462 coastline points, 7452 samples, 74 kB
Variations
- P times and the origin time. Fit the P arrivals themselves, with the moment the quake started as one more unknown in the residuals. This is Geiger's method, the basis of routine location.
- The wrong crust. Generate the records with 5.5 and 3.2 km/s while the game keeps 8.4 km/s. The true factor is then 7.65 km/s and every circle 10 % too large. In round 1 least squares lands 2.41 km from the truth, outside its ellipse, which knows only the reading error, and the floor rises to 4.04 km against an expected 0.48.
- Stations in a line. Use BKS, SM2B, and RVRP, which lie nearly on one east-west line, with round 1's quake. The circles cross in two near-mirror points, one on each side of the line, and the misfit has two valleys. Started from the stations' centroid, least squares walks into the wrong one, 43.7 km from the truth, with a floor of 3.96 km.
- Another network. Swap the station table and the region box for another network, with coordinates from an FDSN station service, the standard web query of seismic data centers such as the NCEDC, and the coastline clip follows.
Further reading
- P. M. Shearer, Introduction to Seismology, 3rd ed. (Cambridge University Press, 2019), section 5.6 on earthquake location, in the chapter on the inversion of travel time data.
- R. C. Aster, B. Borchers, and C. H. Thurber, Parameter Estimation and Inverse Problems, 3rd ed. (Elsevier, 2018), for earthquake location as a nonlinear inverse problem.
- The
scipy.optimize.least_squaresreference, for residual functions, bounds, andres.jac. - The Berkeley Digital Seismic Network, doi:10.7932/BDSN, and Natural Earth, for the stations and the coastline.
- Pointer events and the Canvas API on MDN, for the dragging and the drawing in
game.js. - Related tutorials on this site: Least squares: what a fit minimizes, and why the residuals are squared, curve_fit from the ground up for the covariance, Profile likelihood for when a covariance ellipse misleads, GeoPandas from the ground up for earthquakes near plate boundaries, Map projections, Devito from the ground up for a seismic shot, and Relativistic flight at 0.9 c, the other Minigame.
- Download the notebook. It was executed with the library versions in the header.
- Download the game, one HTML file of 74 kB that runs offline in any browser.